Toll Free: 1-888-928-9744
Toll Free: 1-888-928-9744

Published: Nov, 2015 | Pages:
85 | Publisher: Radiant Insights Inc.
Industry: Plastics | Report Format: Electronic (PDF)
The Report Contains Thermoplastic Polyurethane (TPU) Films Market Analysis By Application (Building & Construction, Automotive, Railways, Furniture, Leisure & Sports, Aerospace, Energy), Competitive Analysis & Forecast, 2012 - 2020 Industry Overview Global thermoplastic polyurethane (TPU) films market size is expected to reach 68.03 kilo tons by 2020, growing at a CAGR of 5.5% from 2014 to 2020. Growth in light vehicle demand in order to increase fuel efficiency is anticipated to drive TPU films market growth over the forecast period. Pricing is a key dynamic in the industry, with consumers being significantly price sensitive. Owing to higher raw material, utility and labor cost, TPU films market prices in North America and Europe are relatively higher compared to Asia Pacific prices, which are generally 25% to 35% cheaper. The global passenger vehicles (including small trucks) in terms of sales was estimated to be 61.9 million units in 2012 which is expected to reach 79.7 million units by the end of 2018, growing at a CAGR of 5.2% from 2013 to 2018. Commercial vehicles sales was estimated to be 20.7 million units in 2012 which is expected to reach 24.9 million units by 2018, growing at a CAGR of 3.8% from 2013 to 2018. They belong to a family of high performance materials, thermoplastic elastomers, which have witnessed increasing application in the automobile industry. This is mainly due to increasing fuel efficiency regulations that have further mandated the use of high performance light weight materials. The impact of using thermoplastic polyurethane for auto component manufacturing was clearly visible as it decreased the overall weight of automobiles to a great extent (almost by 40%). Moreover, the requirements which were earlier fulfilled by traditional rubber components have now turned to thermoplastic polyurethanes. Increase in construction spending particularly in Asia Pacific is anticipated to drive industry demand. The Asian construction industry is now the single largest region in the world, accounting for approximately 40 percent of total global construction spending in 2012. In 2013, China was the largest region for construction spending amounting to approximately USD 1.78 trillion with Japan and India spending estimated up to USD 742 billion and USD 427 billion respectively. Future regional growth prospects are also exceptional compared to other major regions which may increase TPU films market demand. Volatile raw material prices of aniline and propylene are likely to influence MDI and polyols supply thereby affecting overall industry profitability. Increasing investments in research to develop bio-based products from TPU films manufacturers anticipated to open new avenues for industry participants. Companies such as DuPont, Arkema, Merquinsa and PolyOne have ventured into bio based TPU films market.Europe TPU films market size, by application, 2012-2020 (Tons)Application Overview Automotive application witnessed the highest consumption of TPU films with a revenue generation estimated over USD 95 million in 2013. They are generally used in acoustic panels, airbags, anti-vibration panels, door panels, instrument panels and seats. Furniture was the second largest application segment and accounted for over 15% of the total volume in 2013. It is anticipated to witness below average growth rates with an estimated CAGR of over 5% from 2014 to 2020. They are widely used for lamination of furniture and can form good bond with wood and plastic. Regional Overview Asia Pacific was the leading region with a valuation of over USD 105 million in 2013. Increasing consumer spending capacity coupled with government support to increase FDI flow in China and India are likely to favor growth. The aerospace industry is likely to witness considerable growth rate over the next six years, while the automotive sector is anticipated to contribute the most towards revenue generation. North America TPU films market accounted for more than 25% of the total volume in 2013 and is likely to grow at an estimated CAGR of over 4% from 2014 to 2020. North America is mainly triggered by increasing scope in durable applications such as construction, automotive, and energy in the U.S. and Canada. Competitive Market Share The global TPU films market share is highly fragmented with the top four companies accounting for over 40% of total volume in 2013. One of the key reasons for fragmentation is the strong presence of local manufacturers and suppliers in various regions, particularly in China. Customized product offerings, based on client specifications is a strong trend in among the end-users. Bayer Material Science emerged as the leading manufacturer and accounted for over12% of the total volume in 2013. Major manufacturers in this industry include 3M Company, Huntsman Corporation, PAR Group and MH & W International Corporation. Other prominent companies include BASF, Nippon Polyurethane, Avery Dennison, Permali Gloucester Ltd and Lubrizol.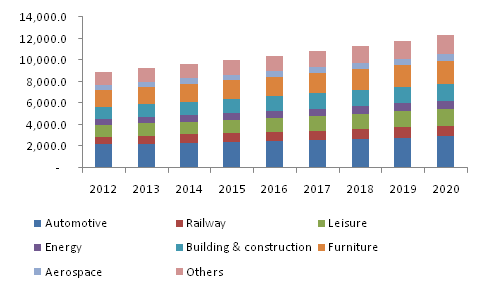
 Table of Content

Chapter 1	Executive Summary
1.1	TPU Films – Industry Summary & Critical Success Factors (CSFs)

Chapter 2	Thermoplastic Polyurethane (TPU) Films – Industry Overview
2.1	Market segmentation
2.2	Market Size and Growth Prospects
2.3	Thermoplastic Polyurethane (TPU) Films - Value Chain Analysis
2.4	Thermoplastic Polyurethane (TPU) Films – Market dynamics
2.4.1	Market driver analysis
2.4.1.1	Increasing penetration in automobile industry
2.4.1.2	Increasing construction spending mainly in Asia Pacific
2.4.2	Market restraint analysis
2.4.2.1	Volatility in raw material prices
2.5	Key opportunities - Prioritized
2.5.1	Key market opportunities
2.5.1.1	Increasing R&D on renewable/sustainable thermoplastic polyurethane
2.6	Industry Analysis – Porter’s
2.7	Thermoplastic Polyurethane (TPU) Films – Company market share analysis, 2013
2.8	Thermoplastic Polyurethane (TPU) Films – PESTEL Analysis

Chapter 3	TPU Films Application Overview
3.1	TPU films market volume share by application, 2013 & 2020
3.2	Automotive
3.2.1	Market estimates & forecast, 2012 - 2020 (Tons) (USD Million)
3.2.2	Market estimates & forecast by region, 2012 - 2020 (Tons) (USD Million)
3.3	Railways
3.3.1	Market estimates & forecast, 2012 - 2020 (Tons) (USD Million)
3.3.2	Market estimates & forecast by region, 2012 - 2020 (Tons) (USD Million)
3.4	Leisure
3.4.1	Market estimates & forecast, 2012 - 2020 (Tons) (USD Million)
3.4.2	Market estimates & forecast by region, 2012 - 2020 (Tons) (USD Million)
3.5	Energy
3.5.1	Market estimates & forecast by region, 2012-2020 (Tons) (USD Million)
3.5.2	Market estimates & forecast by region by region, 2012 - 2020 (Tons) (USD Million)
3.6	Building & construction
3.6.1	Market estimates & forecast by region, 2012-2020 (Tons) (USD Million)
3.6.2	Market estimates & forecast by region by region, 2012-2020 (Tons) (USD Million)
3.7	Furniture
3.7.1	Market estimates & forecast by region, 2012-2020 (Tons) (USD Million)
3.7.2	Market estimates & forecast by region by region, 2012-2020 (Tons) (USD Million)
3.8	Aerospace
3.8.1	Market estimates & forecast by region, 2012-2020 (Tons) (USD Million)
3.8.2	Market estimates & forecast by region by region, 2012-2020 (Tons) (USD Million)
3.9	Others
3.9.1	Market estimates & forecast by region, 2012-2020 (Tons) (USD Million)
3.9.2	Market estimates & forecast by region by region, 2012-2020 (Tons) (USD Million)

Chapter 4	TPU Films Regional Overview
4.1	TPU films market volume share by region, 2013 & 2020
4.2	North America
4.2.1	Market estimates & forecast by region, 2012 - 2020 (Tons) (USD Million)
4.2.2	No Market estimates & forecast by region by application, 2012 – 2020 (Tons) (USD Million)
4.3	Europe
4.3.1	Market estimates & forecast by region, 2012-2020 (Tons) (USD Million)
4.3.2	Market estimates & forecast by region by application, 2012 – 2020 (Tons) (USD Million)
4.4	Asia Pacific
4.4.1	Market estimates & forecast, 2012 - 2020 (Tons) (USD Million)
4.4.2	Market estimates & forecast by region by application, 2012 – 2020 (Tons) (USD Million)
4.5	Japan
4.5.1	Market estimates & forecast, 2012 - 2020 (Tons) (USD Million)
4.5.2	Market estimates & forecast by region by application, 2012 – 2020 (Tons) (USD Million)
4.6	RoW
4.6.1	Market estimates & forecast by region, 2012 - 2020 (Tons) (USD million)
4.6.2	Market estimates & forecast by region by application, 2012 – 2020 (Tons) (USD Million)

Chapter 5	Competitive Landscape
5.1	Permali Gloucester Limited
5.1.1	Company Overview
5.1.2	Financial Performance
5.1.3	Product Benchmarking
5.1.4	Strategic Initiatives
5.2	Bayer MaterialScience
5.2.1	Company Overview
5.2.2	Financial Performance
5.2.3	Product Benchmarking
5.2.4	Strategic Initiatives
5.3	Huntsman
5.3.1	Company Overview
5.3.2	Financial Performance
5.3.3	Product Benchmarking
5.3.4	Strategic Initiatives
5.4	PAR Group
5.4.1	Company Overview
5.4.2	Financial Performance
5.4.3	Product Benchmarking
5.4.4	Strategic Initiatives
5.5	BASF
5.5.1	Company Overview
5.5.2	Financial Performance
5.5.3	Product Benchmarking
5.5.4	Strategic Initiatives
5.6	Lubrizol
5.6.1	Company Overview
5.6.2	Financial Performance
5.6.3	Product Benchmarking
5.6.4	Strategic Initiatives
5.7	Nippon Polyurethane
5.7.1	Company Overview
5.7.2	Financial Performance
5.7.3	Product Benchmarking
5.7.4	Strategic Initiatives
5.8	Yantai Wanhua
5.8.1	Company Overview
5.8.2	Financial Performance
5.8.3	Product Benchmarking
5.8.4	Strategic Initiatives
5.9	American Polyfilm Inc.
5.9.1	Company Overview
5.9.2	Financial Performance
5.9.3	Product Benchmarking
5.10	3M Company
5.10.1	Company Overview
5.10.2	Financial Performance
5.10.3	Product Benchmarking
5.11	Avery Dennison
5.11.1	Company Overview
5.11.2	Financial Performance
5.11.3	Product Benchmarking
5.11.4	Strategic Initiatives
5.12	MH&W International Corp.
5.12.1	Company Overview
5.12.2	Financial Performance
5.12.3	Product Benchmarking
5.12.4	Strategic Initiatives

Chapter 6	Methodology and Scope
6.1	Research Methodology
6.2	Research Scope & Assumptions
6.3	List of Data Sources
List of Tables

TABLE 1	TPU Films – Industry Summary & Critical Success Factors (CSFs)
TABLE 2	Global thermoplastic polyurethane (TPU) films market volume & revenue, 2012 - 2020
TABLE 3	Global thermoplastic polyurethane (TPU) films market volume by region, (Tons), 2012 - 2020
TABLE 4	Global thermoplastic polyurethane (TPU) films market revenue by region, (USD million), 2012 – 2020
TABLE 5	Global thermoplastic polyurethane (TPU) films market volume by application, (Tons), 2012 – 2020
TABLE 6	Global thermoplastic polyurethane (TPU) films market revenue by application, (USD million), 2012 – 2020
TABLE 7	Thermoplastic Polyurethane (TPU) Films – Key market driver analysis
TABLE 8	Thermoplastic Polyurethane (TPU) Films – Key market restraint analysis
TABLE 9	Global demand for TPU films from automotive, 2012 – 2020, (Tons) (USD Million)
TABLE 10	Global TPU films market volume for automotive by region, 2012 – 2020 (Tons)
TABLE 11	Global TPU films market revenue for automotive by region, 2012 – 2020 (USD million)
TABLE 12	Global demand for TPU films from railways, 2012 – 2020, (Tons) (USD Million)
TABLE 13	Global TPU films market volume for railways by region, 2012 – 2020 (Tons)
TABLE 14	Global TPU films market revenue for railways by region, 2012 – 2020 (USD million)
TABLE 15	Global demand for TPU films from leisure, 2012 – 2020, (Tons) (USD Million)
TABLE 16	Global TPU films market volume for leisure, by region, 2012 – 2020 (Tons)
TABLE 17	Global TPU films market revenue for leisure, by region, 2012 – 2020 (USD million)
TABLE 18	Global demand for TPU films from energy, 2012 – 2020, (Tons) (USD Million)
TABLE 19	Global TPU films market volume for energy by region, 2012 – 2020 (Tons)
TABLE 20	Global TPU films market revenue for energy by region, 2012 – 2020 (USD million)
TABLE 21	Global demand for TPU films from building & construction, 2012 – 2020, (Tons) (USD Million)
TABLE 22	Global TPU films market volume for building & construction by region, 2012 – 2020 (Tons)
TABLE 23	Global TPU films market revenue for building & construction by region, 2012 – 2020 (USD million)
TABLE 24	Global demand for TPU films from furniture, 2012 – 2020, (Tons) (USD Million)
TABLE 25	Global TPU films market volume for furniture by region, 2012 – 2020 (Tons)
TABLE 26	Global TPU films market revenue for furniture by region, 2012 – 2020 (USD million)
TABLE 27	Global demand for TPU films from aerospace, 2012 – 2020, (Tons) (USD Million)
TABLE 28	Global TPU films market volume for aerospace by region, 2012 – 2020 (Tons)
TABLE 29	Global TPU films market revenue for aerospace by region, 2012 – 2020 (USD million)
TABLE 30	Global demand for TPU films from other applications, 2012 – 2020, (Tons) (USD Million)
TABLE 31	Global TPU films market volume from other applications by region, 2012 – 2020 (Tons)
TABLE 32	Global TPU films market revenue from other applications by region, 2012 – 2020 (USD million)
TABLE 33	North America TPU films market volume by application, (Tons), 2012 – 2020
TABLE 34	North America TPU films market revenue by application, (USD million), 2012 – 2020
TABLE 35	Europe TPU films volume by application, (Tons), 2012 – 2020
TABLE 36	Europe TPU films market revenue by application, (USD million), 2012 – 2020
TABLE 37	Asia Pacific TPU films volume by application, (Tons), 2012 – 2020
TABLE 38	Asia Pacific TPU films market revenue by application, (USD million), 2012 – 2020
TABLE 39	Japan TPU films volume by application, (Tons), 2012 – 2020
TABLE 40	Japan TPU films market revenue by application, (USD million), 2012 – 2020
TABLE 41	RoW TPU films volume by application, (Tons), 2012 – 2020
TABLE 42	RoW TPU films market revenue by application, (USD million), 2012 – 2020

Speak to the report author to design an exclusive study to serve your research needs.
Your personal and confidential information is safe and secure.

