Toll Free: 1-888-928-9744
Toll Free: 1-888-928-9744

Published: Oct, 2015 | Pages:
110 | Publisher: Radiant Insights Inc.
Industry: Plastics | Report Format: Electronic (PDF)
The Report Contains Synthetic & Bio-based PMMA Market Size By Product (Cell Cast Sheet & Blocks, Extruded Sheets, Pellets, Beads), By Application (Electronics, Construction, Automotive, Signs & Display), Potential, Competitive Analysis & Forecast, 2012 - 2022 Industry Overview Global polymethyl methacrylate (PMMA) market size is expected to reach 3.2 million tons by 2022, growing at a CAGR of 6.4% from 2015 to 2022. Increase in advertising & marketing expenditure in order to build brand equity is anticipated to drive PMMA market growth. Properties such weather resistance, optical clarity, light weight, abrasion resistance and attractive color availability make it an ideal option for use in signs and displays. It is a preferred material for such attractive point of sale applications owing to availability in a variety of bright hues and other options such as transparent, translucent or opaque. Global advertising expenditure was USD 481.68 billion in 2011 which increase to about USD 516.47 billion in 2013. The advertising expenditure market spending is expected to register USD 667.65 billion growing at an estimated CAGR of 5.2% from 2014 to 2018. Growing importance of low-weight vehicles with lower emissions coupled with increasing fuel efficiency demand is expected to drive PMMA market for automobile & transportation applcations. The U.S. government has passed a legislation that requires automakers to improve fuel efficiency up to 54.5 miles per gallon (23.17 km per liter) by 2025. Global automobile production was 82.6 million units in 2012 which increased to 89.3 million units in 2014. According to souces, global automobile production is expected to reach 104.6 million units by 2018 growing at an estimated CAGR of 3.9% from 2015 to 2018. Factors such as high temperature resistance, better abrasion resistance, low coefficient of friction and chemical inertness makes it a widely prefrred material for applications such as lighting (exterior and interior), glazing, body parts (spoilers, pillar trims, roof elements and mirror housings), and decorative trims. Raw materials for MMA manufacturing are petrochemicals such as methanol, acetone and ammonia, prices of which are highly volatile due to inconsistent supply from crude oil manufacturers. This factor is likely to hamper PMMA industry growth. Bio PMMA market size is expected to exceed 535 kilo tons by 2022, with gains of over 16%. Arekema in colaboration with Natureworks has launched bio-based brands known as Plexiglass (U.S.) and Atluglass (Europe). This material is contains Ingeo biopolymers technology which contains about 25% of polylactic acid (PLA). Increasing R&D focus on sustainability, is expected to provide new avenues for bio PMMA market growth. Evonik is building Avneers technology in which bio-based production can be integrated once the process is ready for commercial production. Other companies such as Mitshubishi Rayon in colaboration with its subsidiary company is also developing technology for bio PMMA production. These companies are considering production by using green building blocks of itaconic acid or methcrylic acid. These steps will help to curb carbon emissions in to the atmosphere and reduce the dependebility on fossil reserves.U.S. PMMA market Size, by product, 2012-2022 (Kilo Tons)Product Overview Extruded sheets dominated the global consumption with a market valuation of over USD 3.5 billion in 2014. These extruded sheets are majorly preferred in manufacturing of LED screens used in facades in commercial & residential buildings and solar panels, signs & displays, decorative interiors and electronic devices. Growing popularity of LED screens coupled with development in signs & display segment is anticipated to drive extruded sheets demand. Pellets accounted for more than 25% of the global demand and are likely to witness significant gains of CAGR at over 6.5% up to 2022. They can be molded into desired shapes & sizes and are available in various colors. Converters who further mold these pellets according to the end-use buy this form. The automotive industry is an attractive segment for pellets. Additionally, the signs & display, medical & healthcare, and fashion & apparels segments utilize this form. Application Overview Signs & display was the dominant application segment with an estimated revenue generation of over USD 2.1 billion in 2014. Growing advertising expenditure owing to growing competiveness in various industries has been prompting its use in display boards. It is mainly utilized in displays and visual signage for marketing communication. Electronic applications dominated bio PMMA market demand, with over 34% global volume in 2014. Construction applications accounted for more than 20% of total volume in 2014 and are anticipated to witness moderate growth rates, at over 6% from 2015 to 2022. The construction industry is one of the major consumers. It utilizes cell cast sheets and blocks along with extruded sheets in outdoor facades as well as interiors. It is used in underwater aquariums due to its strength and chemical inertness coupled with optical clarity. Regional Overview Asia Pacific PMMA market was the leading region with valuation estimated over USD 1.3 billion in 2014. This region is also anticipated to witness highest gains over the forecast period. Presence of large consumer base coupled with cheap labor & production cost particularly in China and India, is expected to drive growth. Europe accounted for more than 15% of the global demand in 2014 and is expected to grow at sluggish growth rates of over 3% from 2015 to 2022. Recent Euro crisis has significantly affected many industrial segments such as construction and automobiles. This factor is likely to be responsible for slow growth rate in Europe though this region is expected to perform well in the forecast period. Competitive Market Share The global PMMA market share is highly concentrated, with the top four participants accounting for more than 60%. Companies such as Mitsubishi Rayon Co., Ltd., Arkema SA (Altuglas International), Evonik Industries AG, Chi Mei Corporation and Sumitomo Chemicals are the leading manufacturers. Other prominent companies include LG MMA, The Dow Chemical Company, Asahi Kasei Corporation, Kuraray Co., Ltd, and Polycasa (Quinn Plastics).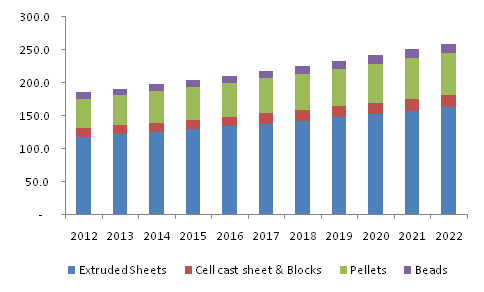
 Table of Content

Chapter 1.	Methodology and Scope
1.1.	Research Methodology
1.2.	Research Scope & Assumptions
1.3.	List of Data Sources

Chapter 2.	Executive Summary
2.1.	PMMA - Industry Summary and Key Buying Criteria, 2012 - 2022

Chapter 3.	Polymethyl Methacrylate (PMMA) Industry Overview
3.1.	PMMA market segmentation
3.2.	PMMA market size and growth prospects, 2012 - 2022
3.3.	PMMA market - Value chain analysis
3.3.1.	Vendor landscape
3.4.	Regulatory framework
3.5.	PMMA industry dynamics
3.5.1.	Market driver analysis
3.5.2.	Market restraint analysis
3.6.	Raw material analysis
3.7.	Key market opportunities – Prioritized
3.8.	Industry analysis - Porter's
3.9.	PMMA company market share, 2014
3.10.	PMMA market PESTEL analysis, 2014

Chapter 4.	PMMA Market Product Overview
4.1.	Global PMMA market share by product, 2014 & 2022
4.2.	Extruded Sheet
4.2.1.	Market estimates and forecast, 2012-2022
4.2.2.	Market estimates and forecast by region, 2012-2022
4.3.	Pellets
4.3.1.	Market estimates and forecast, 2012-2022
4.3.2.	Market estimates and forecast by region, 2012-2022
4.4.	Beads
4.4.1.	Market estimates and forecast, 2012-2022
4.4.2.	Market estimates and forecast by region, 2012-2022

Chapter 5.	PMMA Market Application Overview
5.1.	Global PMMA market share by application, 2014 & 2022
5.2.	Construction
5.2.1.	Market estimates and forecast, 2012-2022
5.2.2.	Market estimates and forecast by region, 2012-2022
5.3.	Electronics
5.3.1.	Market estimates and forecast, 2012-2022
5.3.2.	Market estimates and forecast by region, 2012-2022
5.4.	Automotive
5.4.1.	Market estimates and forecast, 2012-2022
5.4.2.	Market estimates and forecast by region, 2012-2022
5.5.	Signs & display
5.5.1.	Market estimates and forecast, 2012-2022
5.5.2.	Market estimates and forecast by region, 2012-2022
5.6.	Rear/Sidelight units
5.6.1.	Market estimates and forecast, 2012-2022
5.6.2.	Market estimates and forecast by region, 2012-2022
5.7.	Healthcare
5.7.1.	Market estimates and forecast, 2012-2022
5.7.2.	Market estimates and forecast by region, 2012-2022
5.8.	Others
5.8.1.	Market estimates and forecast, 2012-2022
5.8.2.	Market estimates and forecast by region, 2012-2022

Chapter 6.	PMMA Market Regional Overviewb
6.1.	Global PMMA market share by region, 2014 & 2022
6.2.	North America
6.2.1.	Market estimates and forecast, 2012 – 2022
6.2.2.	Market estimates and forecast by product, 2012-2022
6.2.3.	Market estimates and forecast by application, 2012-2022
6.2.4.	U.S.
6.2.4.1.	Market estimates and forecast, 2012 – 2022
6.2.4.2.	Market estimates and forecast by product, 2012-2022
6.2.4.3.	Market estimates and forecast by application, 2012-2022
6.2.5.	Canada
6.2.5.1.	Market estimates and forecast, 2012 – 2022
6.2.5.2.	Market estimates and forecast by product, 2012-2022
6.2.5.3.	Market estimates and forecast by application, 2012-2022
6.2.6.	Mexico
6.2.6.1.	Market estimates and forecast, 2012 – 2022
6.2.6.2.	Market estimates and forecast by product, 2012-2022
6.2.6.3.	Market estimates and forecast by application, 2012-2022
6.3.	Europe
6.3.1.	Market estimates and forecast, 2012 – 2022
6.3.2.	Market estimates and forecast by product, 2012-2022
6.3.3.	Market estimates and forecast by application, 2012-2022
6.3.4.	Germany
6.3.4.1.	Market estimates and forecast, 2012 – 2022
6.3.4.2.	Market estimates and forecast by material type, 2012-2022
6.3.4.3.	Market estimates and forecast by application, 2012-2022
6.3.5.	France
6.3.5.1.	Market estimates and forecast, 2012 – 2022
6.3.5.2.	Market estimates and forecast by material type, 2012-2022
6.3.5.3.	Market estimates and forecast by application, 2012-2022
6.3.5.4.
6.3.6.	UK
6.3.6.1.	Market estimates and forecast, 2012 – 2022
6.3.6.2.	Market estimates and forecast by material type, 2012-2022
6.3.6.3.	Market estimates and forecast by application, 2012-2022
6.4.	Asia Pacific
6.4.1.	Market estimates and forecast, 2012 – 2022
6.4.2.	Market estimates and forecast by material type, 2012-2022
6.4.3.	Market estimates and forecast by application, 2012-2022
6.4.4.	China
6.4.4.1.	Market estimates and forecast, 2012 – 2022
6.4.4.2.	Market estimates and forecast by material type, 2012-2022
6.4.4.3.	Market estimates and forecast by application, 2012-2022
6.4.5.	India
6.4.5.1.	Market estimates and forecast, 2012 – 2022
6.4.5.2.	Market estimates and forecast by material type, 2012-2022
6.4.5.3.	Market estimates and forecast by application, 2012-2022
6.4.6.	South Korea
6.4.6.1.	Market estimates and forecast, 2012 – 2022
6.4.6.2.	Market estimates and forecast by material type, 2012-2022
6.4.6.3.	Market estimates and forecast by application, 2012-2022
6.5.	Central & South America
6.5.1.	Market estimates and forecast, 2012 – 2022
6.5.2.	Market estimates and forecast by material type, 2012-2022
6.5.3.	Market estimates and forecast by application, 2012-2022
6.5.4.	Brazil
6.5.4.1.	Market estimates and forecast, 2012 – 2022
6.5.4.2.	Market estimates and forecast by product, 2012-2022
6.5.4.3.	Market estimates and forecast by application, 2012-2022
6.6.	Middle East & Africa
6.6.1.	Market estimates and forecast, 2012 – 2022
6.6.2.	Market estimates and forecast by material type, 2012-2022
6.6.3.	Market estimates and forecast by application, 2012-2022
6.6.4.	Saudi Arabia
6.6.4.1.	Market estimates and forecast, 2012 – 2022
6.6.4.2.	Market estimates and forecast by product, 2012-2022
6.6.4.3.	Market estimates and forecast by application, 2012-2022

Chapter 7.	Bio PMMA Market Potential
7.1.	Technology Overview
7.2.	Regulatory Support
7.3.	Current Industry Development
7.4.	Bio PMMA Potential Applications
7.4.1.1.	Global Bio-PMMA market share by application, 2014 & 2022
7.4.1.2.	Electronics
7.2.1.2.1	Market estimates and forecast, 2012 – 2022
7.4.1.3.	Automotive
7.2.1.3.1	Market estimates and forecast, 2012 – 2022
7.4.1.4.	Consumer Goods
7.2.1.4.1	Market estimates and forecast, 2012 – 2022
7.4.1.5.	Healthcare
7.2.1.5.1	Market estimates and forecast, 2012 – 2022
7.4.1.6.	Construction
7.2.1.6.1	Market estimates and forecast, 2012 – 2022
7.4.1.7.	Signs & display
7.2.1.7.1	Market estimates and forecast, 2012 – 2022
7.4.1.8.	Others
7.2.1.8.1	Market estimates and forecast, 2012 – 2022
7.5.	Regional Potential
7.5.1.1.	Global Bio-PMMA market share by region, 2014 & 2022
7.5.1.2.	North America
7.3.1.2.1	Market estimates and forecast, 2012 – 2022
7.5.1.3.	Europe
7.3.1.3.1	Market estimates and forecast, 2012 – 2022
7.5.1.4.	Asia Pacific
7.3.1.4.1	Market estimates and forecast, 2012 – 2022
7.5.1.5.	Central & South America
7.3.1.5.1	Market estimates and forecast, 2012 – 2022
7.5.1.6.	Middle East & Africa
7.3.1.6.1	Market estimates and forecast, 2012 – 2022

Chapter 8.	Competitive Landscape
8.1.	Evonik Industries
8.1.1.	Company Overview
8.1.2.	Financial Performance
8.1.3.	Product Benchmarking
8.1.4.	Strategic Initiatives
8.2.	Mitsubishi Rayon Group
8.2.1.	Company Overview
8.2.2.	Financial Performance
8.2.3.	Product Benchmarking
8.2.4.	Strategic Initiatives
8.3.	Altuglas International
8.3.1.	Company Overview
8.3.2.	Financial Performance
8.3.3.	Product Benchmarking
8.3.4.	Strategic Initiatives
8.4.	Kuraray Group
8.4.1.	Company Overview
8.4.2.	Financial Performance
8.4.3.	Product Benchmarking
8.4.4.	Strategic Initiatives
8.5.	Chi Mei Corporation
8.5.1.	Company Overview
8.5.2.	Financial Performance
8.5.3.	Product Benchmarking
8.5.4.	Strategic Initiatives
8.6.	Sumitomo Chemical Co., Ltd.
8.6.1.	Company Overview
8.6.2.	Financial Performance
8.6.3.	Product Benchmarking
8.6.4.	Strategic Initiatives
8.7.	Asahi Kasei Corp.
8.7.1.	Company Overview
8.7.2.	Financial Performance
8.7.3.	Product Benchmarking
8.7.4.	Strategic Initiatives
8.8.	Daesan MMA
8.8.1.	Company Overview
8.8.2.	Financial Performance
8.8.3.	Product Benchmarking
8.8.4.	Strategic Initiatives
8.9.	LG MMA.
8.9.1.	Company Overview
8.9.2.	Financial Performance
8.9.3.	Product Benchmarking
8.9.4.	Strategic Initiatives
8.10.	SABIC
8.10.1.	Company Overview
8.10.2.	Financial Performance
8.10.3.	Product Benchmarking
8.10.4.	Strategic Initiatives
8.11.	Makevale Group
8.11.1.	Company Overview
8.11.2.	Financial Performance
8.11.3.	Product Benchmarking
8.11.4.	Strategic Initiatives
8.12.	Polycasa N.V.
8.12.1.	Company Overview
8.12.2.	Financial Performance
8.12.3.	Product Benchmarking
8.12.4.	Strategic Initiatives
8.13.	Dow Chemical Company
8.13.1.	Company Overview
8.13.2.	Financial Performance
8.13.3.	Product Benchmarking
8.13.4.	Strategic Initiatives
8.14.	Shanghai Jing-Qi Polymer Science Co
8.14.1.	Company Overview
8.14.2.	Financial Performance
8.14.3.	Product Benchmarking
8.14.4.	Strategic Initiatives
List of Tables

TABLE 1	Global PMMA market, (Volume & Revenue), 2012 – 2022
TABLE 2	Global PMMA market volume by region, 2012 – 2022 (Kilo Tons)
TABLE 3	Global PMMA market revenue by region, 2012 – 2022 (USD Million)
TABLE 4	Global PMMA market revenue by product, 2012 – 2022 (Kilo Tons)
TABLE 5	Global PMMA market revenue by product, 2012 – 2022 (USD Million)
TABLE 6	Global PMMA market revenue by application, 2012 – 2022 (Kilo Tons)
TABLE 7	Global PMMA market revenue by application, 2012 – 2022 (USD Million)
TABLE 8 	Vendor landscape
TABLE 9	PMMA – Key market driver analysis
TABLE 10	PMMA – Key market restraint analysis
TABLE 11	Global extruded sheets PMMA market estimates and forecast, 2012 – 2022, (Kilo Tons) (USD Million)
TABLE 12	Global extruded sheets PMMA market volume, by region, 2015– 2022, (Kilo Tons)
TABLE 13	Global extruded sheets PMMA market revenue, by region, 2012– 2022, (USD Million)
TABLE 14	Global cell cast sheets & blocks PMMA market estimates and forecast, 2012 – 2022, (Kilo Tons) (USD Million)
TABLE 15	Global cell cast sheets & blocks PMMA market volume, by region, 2015– 2022, (Kilo Tons)
TABLE 16	Global cell cast sheets & blocks PMMA market revenue, by region, 2012– 2022, (USD Million)
TABLE 17	Global pellets based PMMA market estimates and forecast, 2012 – 2022, (Kilo Tons) (USD Million)
TABLE 18	Global pellets based PMMA market volume, by region, 2015– 2022, (Kilo Tons)
TABLE 19	Global pellets based PMMA market revenue, by region, 2012– 2022, (USD Million)
TABLE 20	Global beads based PMMA market estimates and forecast, 2012 – 2022, (Kilo Tons) (USD Million)
TABLE 21	Global beads based PMMA market volume, by region, 2015– 2022, (Kilo Tons)
TABLE 22	Global beads based PMMA market revenue, by region, 2012– 2022, (USD Million)
TABLE 23	Global PMMA market volume in metals, by region, 2012– 2022, (Kilo Tons)
TABLE 24	Global PMMA market revenue in metals, by region, 2012– 2022, (USD Million)
TABLE 25	Global PMMA market estimates and forecast from construction, 2012 – 2022, (Kilo Tons) (USD Million)
TABLE 26	Global PMMA market volume from construction, by region, 2012– 2022, (Kilo Tons)
TABLE 27	Global PMMA market revenue from construction, by region, 2012– 2022, (USD Million)
TABLE 28	Global PMMA market estimates and forecast from electronics, 2012 – 2022, (Kilo Tons) (USD Million)
TABLE 29	Global PMMA market volume from electronics, by region, 2012 – 2022, (Kilo Tons)
TABLE 30	Global PMMA market revenue from electronics, by region, 2012 – 2022, (USD Million)
TABLE 31	Global PMMA market estimates and forecast from automotive OEM, 2012 – 2022, (Kilo Tons) (USD Million)
TABLE 32	Global PMMA market volume from automotive, by region, 2012 – 2022, (Kilo Tons)
TABLE 33	Global PMMA market revenue from automotive, by region, 2012 – 2022, (USD Million)
TABLE 34	Global PMMA market estimates and forecast from signs & display, 2012 – 2022, (Kilo Tons) (USD Million)
TABLE 35	Global PMMA market volume from signs & display, by region, 2012 – 2022, (Kilo Tons)
TABLE 36	Global PMMA market revenue from signs & display, by region, 2012– 2022, (USD Million)
TABLE 37	Global PMMA market estimates and forecast from rear/sidelight units, 2012 – 2022, (Kilo Tons) (USD Million)
TABLE 38	Global PMMA market volume from rear/sidelight units, by region, 2012 – 2022, (Kilo Tons)
TABLE 39	Global PMMA market revenue from rear/sidelight units, by region, 2012– 2022, (USD Million)
TABLE 40	Global PMMA market estimates and forecast from healthcare, 2012 – 2022, (Kilo Tons) (USD Million)
TABLE 41	Global PMMA market volume from healthcare, by region, 2012 – 2022, (Kilo Tons)
TABLE 42	Global PMMA market revenue from healthcare, by region, 2012– 2022, (USD Million)
TABLE 43	Global PMMA market estimates and forecast from other applications, 2012 – 2022, (Kilo Tons) (USD Million)
TABLE 44	Global PMMA market volume from other applications, by region, 2012 – 2022, (Kilo Tons)
TABLE 45	Global PMMA market revenue from other applications, by region, 2012– 2022, (USD Million)

TABLE 46	North America PMMA market estimates and forecast, 2012 – 2022, (Kilo Tons) (USD Million)
TABLE 47	North America PMMA market volume, by product, 2012– 2022, (Kilo Tons)
TABLE 48	North America PMMA market revenue, by product, 2012– 2022, (USD Million)
TABLE 49	North America PMMA market volume, by application, 2012– 2022, (Kilo Tons)
TABLE 50	North America PMMA market volume, by application, 2012– 2022, (USD Million)
TABLE 51	U.S. PMMA market estimates and forecast, 2012 – 2022, (Kilo Tons) (USD Million)
TABLE 52	U.S. PMMA market volume, by product, 2012– 2022, (Kilo Tons)
TABLE 53	U.S. PMMA market revenue, by product, 2012– 2022, (USD Million)
TABLE 54	U.S. PMMA market volume, by application, 2012– 2022, (Kilo Tons)
TABLE 55	U.S. PMMA market revenue, by application, 2012– 2022, (USD Million)
TABLE 56	Canada PMMA market estimates and forecast, 2012 – 2022, (Kilo Tons) (USD Million)
TABLE 57	Canada PMMA market volume, by product, 2012– 2022, (Kilo Tons)
TABLE 58	Canada PMMA market revenue, by product, 2012– 2022, (USD Million)
TABLE 59	Canada PMMA market volume, by application, 2012– 2022, (Kilo Tons)
TABLE 60	Canada PMMA market revenue, by application, 2012– 2022, (USD Million)
TABLE 61	Mexico PMMA market estimates and forecast, 2012 – 2022, (Kilo Tons) (USD Million)
TABLE 62	Mexico PMMA market volume, by product, 2012– 2022, (Kilo Tons)
TABLE 63	Mexico PMMA market revenue, by product, 2012– 2022, (USD Million)
TABLE 64	Mexico PMMA market volume, by application, 2012– 2022, (Kilo Tons)
TABLE 65	Mexico PMMA market revenue, by application, 2012– 2022, (USD Million)
TABLE 66	Europe PMMA market estimates and forecast, 2012 – 2022, (Kilo Tons) (USD Million)
TABLE 67	Europe PMMA market volume, by product, 2012– 2022, (Kilo Tons)
TABLE 68	Europe PMMA market revenue, by product, 2012– 2022, (USD Million)
TABLE 69	Europe PMMA market volume, by application, 2012– 2022, (Kilo Tons)
TABLE 70	Europe PMMA market volume, by application, 2012– 2022, (USD Million)
TABLE 71	Germany PMMA market estimates and forecast, 2012 – 2022, (Kilo Tons) (USD Million)
TABLE 72	Germany PMMA market volume, by product, 2012– 2022, (Kilo Tons)
TABLE 73	Germany PMMA market revenue, by product, 2012– 2022, (USD Million)
TABLE 74	Germany PMMA market volume, by application, 2012– 2022, (Kilo Tons)
TABLE 75	Germany PMMA market revenue, by application, 2012– 2022, (USD Million)
TABLE 76	UK PMMA market estimates and forecast, 2012 – 2022, (Kilo Tons) (USD Million)
TABLE 77	UK PMMA market volume, by product, 2012– 2022, (Kilo Tons)
TABLE 78	UK PMMA market revenue, by product, 2012– 2022, (USD Million)
TABLE 79	UK PMMA market volume, by application, 2012– 2022, (Kilo Tons)
TABLE 80	UK PMMA market revenue, by application, 2012– 2022, (USD Million)
TABLE 81	France PMMA market estimates and forecast, 2012 – 2022, (Kilo Tons) (USD Million)
TABLE 82	France PMMA market volume, by product, 2012– 2022, (Kilo Tons)
TABLE 83	France PMMA market revenue, by product, 2012– 2022, (USD Million)
TABLE 84	France PMMA market volume, by application, 2012– 2022, (Kilo Tons)
TABLE 85	France PMMA market revenue, by application, 2012– 2022, (USD Million)
TABLE 86	Asia Pacific PMMA market estimates and forecast, 2012 – 2022, (Kilo Tons) (USD Million)
TABLE 87	Asia Pacific PMMA market volume, by product, 2012– 2022, (Kilo Tons)
TABLE 88	Asia Pacific PMMA market revenue, by product, 2012– 2022, (USD Million)
TABLE 89	Asia Pacific PMMA market volume, by application, 2012– 2022, (Kilo Tons)
TABLE 90	Asia Pacific PMMA market volume, by application, 2012– 2022, (USD Million)
TABLE 91	China PMMA market estimates and forecast, 2012 – 2022, (Kilo Tons) (USD Million)
TABLE 92	China PMMA market volume, by product, 2012– 2022, (Kilo Tons)
TABLE 93	China PMMA market revenue, by product, 2012– 2022, (USD Million)
TABLE 94	China PMMA market volume, by application, 2012– 2022, (Kilo Tons)
TABLE 95	China PMMA market revenue, by application, 2012– 2022, (USD Million)
TABLE 96	India PMMA market estimates and forecast, 2012 – 2022, (Kilo Tons) (USD Million)
TABLE 97	India PMMA market volume, by product, 2012– 2022, (Kilo Tons)
TABLE 98	India PMMA market revenue, by product, 2012– 2022, (USD Million)
TABLE 99	India PMMA market volume, by application, 2012– 2022, (Kilo Tons)
TABLE 100	India PMMA market revenue, by application, 2012– 2022, (USD Million)
TABLE 101	South Korea PMMA market estimates and forecast, 2012 – 2022, (Kilo Tons) (USD Million)
TABLE 102	South Korea PMMA market volume, by product, 2012– 2022, (Kilo Tons)
TABLE 103	South Korea PMMA market revenue, by product, 2012– 2022, (USD Million)
TABLE 104	South Korea PMMA market volume, by application, 2012– 2022, (Kilo Tons)
TABLE 105	South Korea PMMA market revenue, by application, 2012– 2022, (USD Million)
TABLE 106	Asia Pacific PMMA market estimates and forecast, 2012 – 2022, (Kilo Tons) (USD Million)
TABLE 107	CSA PMMA market volume, by product, 2012– 2022, (Kilo Tons)
TABLE 108	CSA PMMA market revenue, by product, 2012– 2022, (USD Million)
TABLE 109	CSA PMMA market volume, by application, 2012– 2022, (Kilo Tons)
TABLE 110	CSA PMMA market volume, by application, 2012– 2022, (USD Million)
TABLE 111	Brazil PMMA market estimates and forecast, 2012 – 2022, (Kilo Tons) (USD Million)
TABLE 112	Brazil PMMA market volume, by product, 2012– 2022, (Kilo Tons)
TABLE 113	Brazil PMMA market revenue, by product, 2012– 2022, (USD Million)
TABLE 114	Brazil PMMA market volume, by application, 2012– 2022, (Kilo Tons)
TABLE 115	Brazil PMMA market revenue, by application, 2012– 2022, (USD Million)
TABLE 116	Global PMMA market, (Volume & Revenue), 2012 – 2022
TABLE 117	Global PMMA market volume by region, 2012 – 2022 (Kilo Tons)
TABLE 118	Global PMMA market revenue by region, 2012 – 2022 (USD Million)
TABLE 119	Global PMMA market revenue by product, 2012 – 2022 (Kilo Tons)
TABLE 120	Global PMMA market revenue by product, 2012 – 2022 (USD Million)
TABLE 121	Global PMMA market revenue by application, 2012 – 2022 (Kilo Tons)
TABLE 122	Global PMMA market revenue by application, 2012 – 2022 (USD Million)
TABLE 123	Vendor landscape
TABLE 124	PMMA – Key market driver analysis
TABLE 125	PMMA – Key market restraint analysis
TABLE 126	Global extruded sheets PMMA market estimates and forecast, 2012 – 2022, (Kilo Tons) (USD Million)
TABLE 127	Global extruded sheets PMMA market volume, by region, 2015– 2022, (Kilo Tons)
TABLE 128	Global extruded sheets PMMA market revenue, by region, 2012– 2022, (USD Million)
TABLE 129	Global cell cast sheets & blocks PMMA market estimates and forecast, 2012 – 2022, (Kilo Tons) (USD Million)
TABLE 130	Global cell cast sheets & blocks PMMA market volume, by region, 2015– 2022, (Kilo Tons)
TABLE 131	Global cell cast sheets & blocks PMMA market revenue, by region, 2012– 2022, (USD Million)
TABLE 132	Global pellets based PMMA market estimates and forecast, 2012 – 2022, (Kilo Tons) (USD Million)
TABLE 133	Global pellets based PMMA market volume, by region, 2015– 2022, (Kilo Tons)
TABLE 134	Global pellets based PMMA market revenue, by region, 2012– 2022, (USD Million)
TABLE 135	Global beads based PMMA market estimates and forecast, 2012 – 2022, (Kilo Tons) (USD Million)
TABLE 136	Global beads based PMMA market volume, by region, 2015– 2022, (Kilo Tons)
TABLE 137	Global beads based PMMA market revenue, by region, 2012– 2022, (USD Million)
TABLE 138	Global PMMA market volume in metals, by region, 2012– 2022, (Kilo Tons)
TABLE 139	Global PMMA market revenue in metals, by region, 2012– 2022, (USD Million)
TABLE 140	Global PMMA market estimates and forecast from construction, 2012 – 2022, (Kilo Tons) (USD Million)
TABLE 141	Global PMMA market volume from construction, by region, 2012– 2022, (Kilo Tons)
TABLE 142	Global PMMA market revenue from construction, by region, 2012– 2022, (USD Million)
TABLE 143	Global PMMA market estimates and forecast from electronics, 2012 – 2022, (Kilo Tons) (USD Million)
TABLE 144	Global PMMA market volume from electronics, by region, 2012 – 2022, (Kilo Tons)
TABLE 145	Global PMMA market revenue from electronics, by region, 2012 – 2022, (USD Million)
TABLE 146	Global PMMA market estimates and forecast from automotive OEM, 2012 – 2022, (Kilo Tons) (USD Million)
TABLE 147	Global PMMA market volume from automotive, by region, 2012 – 2022, (Kilo Tons)
TABLE 148	Global PMMA market revenue from automotive, by region, 2012 – 2022, (USD Million)
TABLE 149	Global PMMA market estimates and forecast from signs & display, 2012 – 2022, (Kilo Tons) (USD Million)
TABLE 150	Global PMMA market volume from signs & display, by region, 2012 – 2022, (Kilo Tons)
TABLE 151	Global PMMA market revenue from signs & display, by region, 2012– 2022, (USD Million)
TABLE 152	Global PMMA market estimates and forecast from rear/sidelight units, 2012 – 2022, (Kilo Tons) (USD Million)
TABLE 153	Global PMMA market volume from rear/sidelight units, by region, 2012 – 2022, (Kilo Tons)
TABLE 154	Global PMMA market revenue from rear/sidelight units, by region, 2012– 2022, (USD Million)
TABLE 155	Global PMMA market estimates and forecast from healthcare, 2012 – 2022, (Kilo Tons) (USD Million)
TABLE 156	Global PMMA market volume from healthcare, by region, 2012 – 2022, (Kilo Tons)
TABLE 157	Global PMMA market revenue from healthcare, by region, 2012– 2022, (USD Million)
TABLE 158	Global PMMA market estimates and forecast from other applications, 2012 – 2022, (Kilo Tons) (USD Million)
TABLE 159	Global PMMA market volume from other applications, by region, 2012 – 2022, (Kilo Tons)
TABLE 160	Global PMMA market revenue from other applications, by region, 2012– 2022, (USD Million)
TABLE 161	North America PMMA market estimates and forecast, 2012 – 2022, (Kilo Tons) (USD Million)
TABLE 162	North America PMMA market volume, by product, 2012– 2022, (Kilo Tons)
TABLE 163	North America PMMA market revenue, by product, 2012– 2022, (USD Million)
TABLE 164	North America PMMA market volume, by application, 2012– 2022, (Kilo Tons)
TABLE 165	North America PMMA market volume, by application, 2012– 2022, (USD Million)
TABLE 166	U.S. PMMA market estimates and forecast, 2012 – 2022, (Kilo Tons) (USD Million)
TABLE 167	U.S. PMMA market volume, by product, 2012– 2022, (Kilo Tons)
TABLE 168	U.S. PMMA market revenue, by product, 2012– 2022, (USD Million)
TABLE 169	U.S. PMMA market volume, by application, 2012– 2022, (Kilo Tons)
TABLE 170	U.S. PMMA market revenue, by application, 2012– 2022, (USD Million)
TABLE 171	Canada PMMA market estimates and forecast, 2012 – 2022, (Kilo Tons) (USD Million)
TABLE 172	Canada PMMA market volume, by product, 2012– 2022, (Kilo Tons)
TABLE 173	Canada PMMA market revenue, by product, 2012– 2022, (USD Million)
TABLE 174	Canada PMMA market volume, by application, 2012– 2022, (Kilo Tons)
TABLE 175	Canada PMMA market revenue, by application, 2012– 2022, (USD Million)
TABLE 176	Mexico PMMA market estimates and forecast, 2012 – 2022, (Kilo Tons) (USD Million)
TABLE 177	Mexico PMMA market volume, by product, 2012– 2022, (Kilo Tons)
TABLE 178	Mexico PMMA market revenue, by product, 2012– 2022, (USD Million)
TABLE 179	Mexico PMMA market volume, by application, 2012– 2022, (Kilo Tons)
TABLE 180	Mexico PMMA market revenue, by application, 2012– 2022, (USD Million)
TABLE 181	Europe PMMA market estimates and forecast, 2012 – 2022, (Kilo Tons) (USD Million)
TABLE 182	Europe PMMA market volume, by product, 2012– 2022, (Kilo Tons)
TABLE 183	Europe PMMA market revenue, by product, 2012– 2022, (USD Million)
TABLE 184	Europe PMMA market volume, by application, 2012– 2022, (Kilo Tons)
TABLE 185	Europe PMMA market volume, by application, 2012– 2022, (USD Million)
TABLE 186	Germany PMMA market estimates and forecast, 2012 – 2022, (Kilo Tons) (USD Million)
TABLE 187	Germany PMMA market volume, by product, 2012– 2022, (Kilo Tons)
TABLE 188	Germany PMMA market revenue, by product, 2012– 2022, (USD Million)
TABLE 189	Germany PMMA market volume, by application, 2012– 2022, (Kilo Tons)
TABLE 190	Germany PMMA market revenue, by application, 2012– 2022, (USD Million)
TABLE 191	UK PMMA market estimates and forecast, 2012 – 2022, (Kilo Tons) (USD Million)
TABLE 192	UK PMMA market volume, by product, 2012– 2022, (Kilo Tons)
TABLE 193	UK PMMA market revenue, by product, 2012– 2022, (USD Million)
TABLE 194	UK PMMA market volume, by application, 2012– 2022, (Kilo Tons)
TABLE 195	UK PMMA market revenue, by application, 2012– 2022, (USD Million)
TABLE 196	France PMMA market estimates and forecast, 2012 – 2022, (Kilo Tons) (USD Million)
TABLE 197	France PMMA market volume, by product, 2012– 2022, (Kilo Tons)
TABLE 198	France PMMA market revenue, by product, 2012– 2022, (USD Million)
TABLE 199	France PMMA market volume, by application, 2012– 2022, (Kilo Tons)
TABLE 200	France PMMA market revenue, by application, 2012– 2022, (USD Million)
TABLE 201	Asia Pacific PMMA market estimates and forecast, 2012 – 2022, (Kilo Tons) (USD Million)
TABLE 202	Asia Pacific PMMA market volume, by product, 2012– 2022, (Kilo Tons)
TABLE 203	Asia Pacific PMMA market revenue, by product, 2012– 2022, (USD Million)
TABLE 204	Asia Pacific PMMA market volume, by application, 2012– 2022, (Kilo Tons)
TABLE 205	Asia Pacific PMMA market volume, by application, 2012– 2022, (USD Million)
TABLE 206	China PMMA market estimates and forecast, 2012 – 2022, (Kilo Tons) (USD Million)
TABLE 207	China PMMA market volume, by product, 2012– 2022, (Kilo Tons)
TABLE 208	China PMMA market revenue, by product, 2012– 2022, (USD Million)
TABLE 209	China PMMA market volume, by application, 2012– 2022, (Kilo Tons)
TABLE 210	China PMMA market revenue, by application, 2012– 2022, (USD Million)
TABLE 211	India PMMA market estimates and forecast, 2012 – 2022, (Kilo Tons) (USD Million)
TABLE 212	India PMMA market volume, by product, 2012– 2022, (Kilo Tons)
TABLE 213	India PMMA market revenue, by product, 2012– 2022, (USD Million)
TABLE 214	India PMMA market volume, by application, 2012– 2022, (Kilo Tons)
TABLE 215	India PMMA market revenue, by application, 2012– 2022, (USD Million)
TABLE 216	South Korea PMMA market estimates and forecast, 2012 – 2022, (Kilo Tons) (USD Million)
TABLE 217	South Korea PMMA market volume, by product, 2012– 2022, (Kilo Tons)
TABLE 218	South Korea PMMA market revenue, by product, 2012– 2022, (USD Million)
TABLE 219	South Korea PMMA market volume, by application, 2012– 2022, (Kilo Tons)
TABLE 220	South Korea PMMA market revenue, by application, 2012– 2022, (USD Million)
TABLE 221	CSA PMMA market estimates and forecast, 2012 – 2022, (Kilo Tons) (USD Million)
TABLE 222	CSA PMMA market volume, by product, 2012– 2022, (Kilo Tons)
TABLE 223	CSA PMMA market revenue, by product, 2012– 2022, (USD Million)
TABLE 224	CSA PMMA market volume, by application, 2012– 2022, (Kilo Tons)
TABLE 225	CSA PMMA market volume, by application, 2012– 2022, (USD Million)
TABLE 226	Brazil PMMA market estimates and forecast, 2012 – 2022, (Kilo Tons) (USD Million)
TABLE 227	Brazil PMMA market volume, by product, 2012– 2022, (Kilo Tons)
TABLE 228	Brazil PMMA market revenue, by product, 2012– 2022, (USD Million)
TABLE 229	Brazil PMMA market volume, by application, 2012– 2022, (Kilo Tons)
TABLE 230	Brazil PMMA market revenue, by application, 2012– 2022, (USD Million)
TABLE 231	MEA PMMA market estimates and forecast, 2012 – 2022, (Kilo Tons) (USD Million)
TABLE 232	MEA PMMA market volume, by product, 2012– 2022, (Kilo Tons)
TABLE 233	MEA PMMA market revenue, by product, 2012– 2022, (USD Million)
TABLE 234	MEA PMMA market volume, by application, 2012– 2022, (Kilo Tons)
TABLE 235	MEA PMMA market volume, by application, 2012– 2022, (USD Million)
TABLE 236	Saudi Arabia PMMA market estimates and forecast, 2012 – 2022, (Kilo Tons) (USD Million)
TABLE 237	Saudi Arabia PMMA market volume, by product, 2012– 2022, (Kilo Tons)
TABLE 238	Saudi Arabia PMMA market revenue, by product, 2012– 2022, (USD Million)
TABLE 239	Saudi Arabia PMMA market volume, by application, 2012– 2022, (Kilo Tons)
TABLE 240	Saudi Arabia PMMA market revenue, by application, 2012– 2022, (USD Million)
TABLE 241	Global bio based PMMA market volume from electronics, by region, 2012– 2022, (Kilo Tons)
TABLE 242	Global bio based PMMA market revenue from electronics, by region, 2012– 2022, (USD Million)
TABLE 243	Global bio based PMMA market volume from automotive, by region, 2012– 2022, (Kilo Tons)
TABLE 244	Global bio based PMMA market revenue from automotive, by region, 2012– 2022, (USD Million)
TABLE 245	Global bio based PMMA market volume from automotive, by region, 2012– 2022, (Kilo Tons)
TABLE 246	Global bio based PMMA market revenue from automotive, by region, 2012– 2022, (USD Million)
TABLE 247	Global bio based PMMA market volume from consumer goods, by region, 2012– 2022, (Kilo Tons)
TABLE 248	Global bio based PMMA market revenue from consumer goods, by region, 2012– 2022, (USD Million)
TABLE 249	Global bio based PMMA market volume from healthcare, by region, 2012– 2022, (Kilo Tons)
TABLE 250	Global bio based PMMA market revenue from healthcare, by region, 2012– 2022, (USD Million)
TABLE 251	Global bio based PMMA market volume from construction, by region, 2012– 2022, (Kilo Tons)
TABLE 252	Global bio based PMMA market revenue from construction, by region, 2012– 2022, (USD Million)
TABLE 253	Global bio based PMMA market volume from signs & display, by region, 2012– 2022, (Kilo Tons)
TABLE 254	Global bio based PMMA market revenue from signs & display, by region, 2012– 2022, (USD Million)
TABLE 255	Global bio based PMMA market volume from other applications, by region, 2012– 2022, (Kilo Tons)
TABLE 256	Global bio based PMMA market revenue from other applications, by region, 2012– 2022, (USD Million)

Speak to the report author to design an exclusive study to serve your research needs.
Your personal and confidential information is safe and secure.

