Toll Free: 1-888-928-9744
Toll Free: 1-888-928-9744

Published: Oct, 2015 | Pages:
136 | Publisher: Radiant Insights Inc.
Industry: Chemicals | Report Format: Electronic (PDF)
The Report Contains PP (Polypropylene) Nonwoven Fabric Market Size By Application (Hygiene, Industrial, Medical, Geotextiles, Furniture, Carpet, Agriculture), By Product (Spunbonded, Staples, Meltblown, Composite) , Competitive Analysis & Forecast, 2012 - 2020 Industry Overview Global PP (polypropylene) nonwoven fabric market size is expected to reach 9.98 million tons by 2020, growing at a CAGR of 7.8% from 2014 to 2020. Increasing awareness towards adoption of hygiene products such as baby diapers and adult incontinence products particularly in Asia Pacific is expected to drive the PP nonwoven fabric market demand. PP nonwoven fabric is witnessing wide acceptance over its other counter nonwoven fabric products such as nylon and polyesters owing to its durability and super quality. Polypropylene (fiber and polymer) is the leading raw material used for manufacturing nonwoven fabric globally. Increase in baby diapers demand owing to growing birth rate in Asia Pacific countries such as China, India, Malaysia and Indonesia is expected to positively influence the demand. The Chinese baby diapers market was valued at USD 2.25 billion in 2011 and is expected to reach USD 4.98 billion by 2015. In November 2013, China’s government modified their one-child policy, which was established in 1979 to stop population growth, which now allows couples, which have one parent with no sibling, to have a second child. This amendment is estimated to impact about 5.8% of China’s total population. Growing geriatric population particularly in U.S., Western Europe and Japan is expected to drive incontinence care products demand. The global r incontinence care product markets was valued at USD 7.9 billion in 2012 and is expected to reach USD 12.3 billion by 2020, growing at a CAGR of 5.6% from 2013 to 2020. Rising prevalence of diseases such as Crohn's disease, inflammatory bowel disease and high patient awareness levels are the most significant growth drivers of this market. Increasing scope in durable applications owing to rapid industrialization in emerging economies of Asia Pacific and Latin America is likely to surge the demand. Various durable applications include waste contaminant, automotive, home furnishing, agriculture and geotextiles. Polypropylene is a durable polymer used for various applications because of its excellent resistance to degradation in harsh environments. Currently, these fabrics are used in more than 80% of waste containment applications. Volatility in polypropylene prices owing to fluctuating crude oil prices is expected to affect the profitability of the industry participants. Stringent environmental regulations imposed by governing authorities owing to carbon emissions are also likely to challenge industry growth. Increasing investments to develop bio-derived polypropylene is expected to open new avenues for industry.North America PP nonwoven fabric market, by product, 2012-2020 (Kilo tons))Product Overview Spunbonded was the largest product segment for PP nonwoven fabric market with revenue exceeding USD 8.5 billion by 2013. Spunbonded products have already penetrated the disposable market and are poised for growth in durable applications such as geotextiles, residential and commercial wall wrap and ground covers, home furnishings (furniture construction fabrics and carpet backing), medical and industrial protective apparel and automotive. Staples PP nonwoven fabric was the second largest and accounted for more than 30% of the total volume. Meltblown PP nonwoven was valued at over USD 3 billion in 2013 and is expected to grow at above average growth rates with an estimated CAGR of over 7.5% up to 2020. Application Overview Hygiene was the leading application segment with a market valuation exceeding USD 8.3 billion in 2013. This segment is expected to witness moderate growth rates over the forecast period owing to cultural issues regarding the usage of baby diapers and feminine disposable products in some countries. Industrial applications were the second largest and it accounted for more than 12% of the market share in 2013. They are used in industrial applications for manufacturing coated fabrics, conveyer belts, display felts, noise absorber felt, cable insulation, air conditioner filters, tapes and semiconductor polishing pads. Furniture application is expected to be the fastest growing with an estimated CAGR of over 9% up to 2020. PP nonwoven fabrics are used for manufacturing furniture construction sheeting, bedding construction sheeting, insulators, arms and back, dust covers, blankets, spring wraps acoustical wall coverings, spring wraps and table decoration. Growth is expected from BRICS countries and Saudi Arabia owing to increasing residential and commercial spending in these regions. Regional Overview Asia Pacific was the leading region for PP nonwoven fabric market and revenue generated was estimated exceeding USD 7 billion in 2013. Population expansion coupled with rise in per-capita disposable income in countries such as China and India is expected to drive regional demand. Increasing infrastructure spending is also likely to surge Asia Pacific’s demand. North America PP nonwoven fiber market was the second largest regional industry with a share of over 21% of the total volume in 2013. Increasing incontinence products demand owing to ageing population particularly in U.S. is anticipated to drive the demand. Western Europe is expected to witness sluggish growth rates with an estimated CAGR of over 5% up to 2020 owing to represent a fairly mature market. Middle East is expected to witness significant growth rates with a CAGR of over 10% from 2014 to 2020. Competitive Market Share Global PP nonwoven fabric market share is highly consolidated with top four companies comprising of over 40% of the global demand. The industry is characterized by frequent mergers & acquisitions owing to increase company market share and regional presence. PGI emerged as the leading PP nonwoven fabric producer and accounted for over 15% of total market in 2013. PGI recently acquired Fiberweb to become the leading PP nonwoven fabric manufacturer PGI was followed by Kimberly-Clark which accounted for more than 12% of the total market in 2013. Forward integration by Kimberly-Clark to manufacture PP nonwoven fabric based hygiene products has been one of the critical factors behind the company’s success. Other prominent companies include AVGOL, First Quality, PEGAS, Fibertex, Mitsui, Fitesa and Toray which together accounted for more than 20% of the total industry share.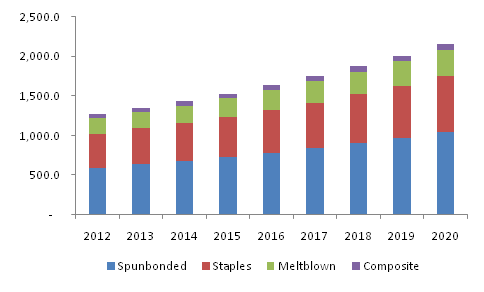
 Chapter 1 Executive Summary
1.1 PP Nonwoven Fabric – Industry Summary & Critical Success Factors (CSFs)

Chapter 2 PP Nonwoven Fabric Industry Overview
2.1 Market Segmentation
2.2 Market Size and Growth Prospects
2.3 PP Nonwoven Fabric Value Chain Analysis
2.4 PP Nonwoven Fabric Market Dynamics
2.4.1 Market driver analysis
2.4.1.1 Increasing birth rate
2.4.1.2 Increasing market penetration for durable applications
2.4.2 Market restraint analysis
2.4.2.1 Stringent regulatory scenario
2.4.2.2 Volatility in raw material prices
2.5 Key Opportunities Prioritized
2.6 Industry Analysis - Porter's
2.7 PP Nonwoven Fabric Company Market Share Analysis
2.8 PP Nonwoven Fabric PESTEL Analysis

Chapter 3 PP Nonwoven Fabric Product Overview
3.1 Spunbonded
3.1.1. Global spunbonded PP nonwoven fabric market volume and revenue, 2012-2020, (Kilo Tons), (USD million)
3.2 Staples
3.2.1 Global staple PP nonwoven fabric market volume and revenue, 2012-2020, (Kilo Tons), (USD million)
3.3 Meltblown
3.3.1 Global meltblown PP nonwoven fabric market volume and revenue, 2012-2020, (Kilo Tons), (USD million)
3.4 Composite
3.4.1 Global composite PP nonwoven fabric market volume and revenue, 2012-2020, (Kilo Tons), (USD million)

Chapter 4 PP Nonwoven Fabric Application Overview
4.1 Hygiene
4.1.1 Global PP Nonwoven Fabric market volume and revenue from hygiene, 2012-2020 (Kilo Tons), (USD million)
4.2 Industrial
4.2.1 Global PP Nonwoven Fabric market volume and revenue from industrial application, 2012-2020 (Kilo Tons), (USD million)
4.3 Medical
4.3.1 Global PP Nonwoven Fabric market volume and revenue from medical, 2012-2020 (Kilo Tons), (USD million)
4.4 Geotextiles
4.4.1 Global PP Nonwoven Fabric market volume and revenue from geotextiles, 2012-2020 (Kilo Tons), (USD million)
4.5 Furniture
4.5.1 Global PP Nonwoven Fabric market volume and revenue from furniture, 2012-2020 (Kilo Tons), (USD million)
4.6 Carpet
4.6.1 Global PP Nonwoven Fabric market volume and revenue from carpet, 2012-2020 (Kilo Tons), (USD million)
4.7 Agriculture
4.7.1 Global PP Nonwoven Fabric market volume and revenue from agriculture, 2012-2020 (Kilo Tons), (USD million)
4.8 Other
4.7.1 Global PP Nonwoven Fabric market volume and revenue from other applications, 2012-2020 (Kilo Tons), (USD million)

Chapter 5 PP Nonwoven Fabric Regional Overview
5.1 North America
5.1.1 North America PP Nonwoven Fabric market volume & revenue by product, 2012-2020 (Kilo Tons), (USD million)
5.1.2 North America PP Nonwoven Fabric market volume & revenue by application, 2012-2020 (Kilo Tons), (USD million)
5.2 Western Europe
5.2.1 Western Europe PP Nonwoven Fabric market volume & revenue by product, 2012-2020 (Kilo Tons), (USD million)
5.2.2 Western Europe PP Nonwoven Fabric market volume & revenue by application, 2012-2020 (Kilo Tons), (USD million)
5.3 Asia Pacific
5.3.1 Asia Pacific PP Nonwoven Fabric market volume & revenue by product, 2012-2020 (Kilo Tons), (USD million)
5.3.2 Asia Pacific PP Nonwoven Fabric market volume & revenue by application, 2012-2020 (Kilo Tons), (USD million)
5.4 Middle East
5.4.1 Middle East PP Nonwoven Fabric market volume & revenue by product, 2012-2020 (Kilo Tons), (USD million)
5.4.2 Middle East PP Nonwoven Fabric market volume & revenue by application, 2012-2020 (Kilo Tons), (USD million)
5.4.3 Saudi Arabia PP Nonwoven Fabric market estimates and forecast, 2012-2020 (Kilo Tons), (USD million)
5.4.3.1 Saudi Arabia PP Nonwoven Fabric market volume & revenue by product, 2012-2020 (Kilo Tons), (USD million)
5.4.3.1 Saudi Arabia PP Nonwoven Fabric market volume & revenue by application, 2012-2020 (Kilo Tons), (USD million)
5.5 RoW
5.5.1 RoW PP Nonwoven Fabric market volume & revenue, 2012-2020 (Kilo Tons), (USD million)
5.5.2 RoW PP Nonwoven Fabric market volume & revenue by application, 2012-2020 (Kilo Tons), (USD million)

Chapter 6 Competitive Landscape
6.1. Kimberly-Clark Corporation
6.1.1. Company Overview
6.1.2. Financial Performance
6.1.3. Product Benchmarking
6.1.4. Strategic Initiatives
6.2. Polymer Group Inc.
6.2.1. Company Overview
6.2.2. Financial Performance
6.2.3. Product Benchmarking
6.2.4. Strategic Initiatives
6.3. Avgol Nonwoven Industries
6.3.1. Company Overview
6.3.2. Financial Performance
6.3.3. Product Benchmarking
6.3.4. Strategic Initiatives
6.4 First Quality Nonwovens Inc.
6.4.1. Company Overview
6.4.2. Financial Performance
6.4.3. Product Benchmarking
6.4.4. Strategic Initiatives
6.5. Companhia Providência
6.5.1. Company Overview
6.5.2. Financial Performance
6.5.3. Product Benchmarking
6.5.4. Strategic Initiatives
6.6. PEGAS NONWOVENS s.r.o
6.6.1. Company Overview
6.6.2. Financial Performance
6.6.3. Product Benchmarking
6.6.4. Strategic Initiatives
6.7. Fibertex Nonwovens S/A
6.7.1. Company Overview
6.7.2. Financial Performance
6.7.3. Product Benchmarking
6.7.4. Strategic Initiatives
6.8. Mitsui Chemicals Inc.
6.8.1. Company Overview
6.8.2. Financial Performance
6.8.3. Product Benchmarking
6.8.4. Strategic Initiatives
6.9. Fitesa
6.9.1. Company Overview
6.9.2. Financial Performance
6.9.3. Product Benchmarking
6.9.4. Strategic Initiatives
6.10. Fiberweb
6.10.1. Company Overview
6.10.2. Financial Performance
6.10.3. Product Benchmarking
6.10.4. Strategic Initiatives
6.11. Toray Industries Inc.
6.11.1. Company Overview
6.11.2. Financial Performance
6.11.3. Product Benchmarking
6.11.4. Strategic Initiatives
6.12. ExxonMobil Corporation
6.12.1. Company Overview
6.12.2. Financial Performance
6.12.3. Product Benchmarking
6.12.4. Strategic Initiatives
6.13. SABIC
6.13.1. Company Overview
6.13.2. Financial Performance
6.13.3. Product Benchmarking
6.13.4. Strategic Initiatives

Chapter 7 Methodology & Scope
7.1 Research Methodology
7.2 Research Scope & Assumptions
7.3 List of Data Sources
List of Tables

1.	PP nonwoven fabric – Industry Summary & Critical Success Factors (CSFs)
2.	Global PP nonwoven fabric market volume and revenue, 2012 - 2020
3.	PP nonwoven fabric – Key driver analysis
4.	PP nonwoven fabric – Key restraint analysis
5.	Global spunbonded PP nonwoven fabric market volume & revenue, 2012-2020 (Kilo Tons), (USD million)
6.	Global staples PP nonwoven fabric market volume & revenue, 2012-2020 (Kilo Tons), (USD million)
7.	Global meltblown PP nonwoven fabric market volume & revenue, 2012-2020 (Kilo Tons), (USD million)
8.	Global composite PP nonwoven fabric market volume & revenue, 2012-2020 (Kilo Tons), (USD million)
9.	Global PP nonwoven fabric demand from hygiene, (volume & revenue), 2012-2020
10.	Global PP nonwoven fabric demand from industrial, (volume & revenue), 2012-2020
11.	Global nonwoven fabric demand from medical, (volume & revenue), 2012-2020
12.	Global PP nonwoven fabric demand from geotextiles, (volume & revenue), 2012-2020
13.	Global PP nonwoven fabric demand from furniture, (volume & revenue), 2012-2020
14.	Global PP nonwoven fabric demand from carpet, (volume & revenue), 2012-2020
15.	Global PP nonwoven fabric demand from agriculture, (volume & revenue), 2012-2020
16.	Global PP nonwoven fabric demand from other industries, (volume & revenue), 2012-2020
17.	North America PP nonwoven fabric market volume, by product, 2012 - 2020 (Kilo Tons)
18.	North America PP nonwoven fabric market revenue, by product, 2012 - 2020 (USD Million)
19.	North America PP nonwoven fabric market volume, by application, 2012 - 2020 (Kilo Tons)
20.	North America PP nonwoven fabric market revenue, by application, 2012 - 2020 (USD Million)
21.	Western Europe PP nonwoven fabric market volume, by product, 2012 - 2020 (Kilo Tons)
22.	Western Europe PP nonwoven fabric market revenue, by product, 2012 - 2020 (USD Million)
23.	Western Europe PP nonwoven fabric market volume, by application, 2012 - 2020 (Kilo Tons)
24.	Western Europe PP nonwoven fabric market revenue, by application, 2012 - 2020 (USD Million)
25.	Asia Pacific PP nonwoven fabric market volume, by product, 2012 - 2020 (Kilo tons)
26.	Asia Pacific PP nonwoven fabric market revenue, by product, 2012 - 2020 (USD Million)
27.	Asia Pacific PP nonwoven fabric market volume, by application, 2012 - 2020 (Kilo tons)
28.	Asia Pacific PP nonwoven fabric market revenue, by application, 2012 - 2020 (USD Million)
29.	Middle East PP nonwoven fabric market volume, by product, 2012 - 2020 (Kilo Tons)
30.	Middle East PP nonwoven fabric market revenue, by product, 2012 - 2020 (USD Million)
31.	Middle East PP nonwoven fabric market volume, by application, 2012 - 2020 (Kilo Tons)
32.	Middle East PP nonwoven fabric market revenue, by application, 2012 - 2020 (USD Million)
33.	Saudi Arabia PP nonwoven fabric market volume & revenue, 2012-2020 (Kilo Tons), (USD million)
34.	Saudi Arabia PP nonwoven fabric market volume, by product, 2012 - 2020 (Kilo Tons)
35.	Saudi Arabia PP nonwoven fabric market revenue, by product, 2012 - 2020 (USD Million)
36.	Saudi Arabia PP nonwoven fabric market volume, by application, 2012 - 2020 (Kilo Tons)
37.	Saudi Arabia PP nonwoven fabric market revenue, by application, 2012 - 2020 (USD Million)
38.	RoW PP nonwoven fabric market volume, by product, 2012 - 2020 (Kilo Tons)
39.	RoW PP nonwoven fabric market revenue, by product, 2012 - 2020 (USD Million)
40.	RoW PP nonwoven fabric market volume, by applications, 2012 - 2020 (Kilo Tons)
41.	RoW PP nonwoven fabric market revenue, by applications, 2012 - 2020 (USD Million)

Speak to the report author to design an exclusive study to serve your research needs.
Your personal and confidential information is safe and secure.

