Toll Free: 1-888-928-9744
Toll Free: 1-888-928-9744

Published: Sep, 2015 | Pages:
54 | Publisher: Grand View Research
Industry: Plastics | Report Format: Electronic (PDF)
Industry Overview Global liquid crystal polymer (LCP) market size is expected to reach 81.7 kilo tons by 2020, growing at a CAGR of 8.6% from 2014 to 2020. Increasing demand for miniaturized electronic components such as connectors and surface mount devices is expected to drive market growth over the next six years. Device or product miniaturization allows manufacturers for streamlining devices to incorporate more and more features in to smaller packages. Global increase in consumer electronics demand such as laptops, tablets, and cellular phones is expected to fuel liquid crystal polymer market growth over the forecast period. Electronics devices shipments, which include Personal Computers (PC), ultra-mobiles, tablets, and cell phones was 2.22 billion units in 2012, and is expected to reach 2.6 billion units by 2015. Tablet and cell phones market is expected to witness an increase in demand in contrast to PCs over the forecast period. Increasing micro injection molding demand coupled with high-temperature resistance and flow properties are expected to drive demand. Thin wall designs pose challenges during injection molding of micro-connectors for devices such as computers, laptops, tablets, robots, and satellites. LCP possesses properties such as excellent insulation, high fluidity, high heat tolerance, chemical resistance, dimensional stability, flatness, and high stiffness. LCP is preferred for manufacturing ultra-thin components up to 0.1mm over other engineering resins such as polyphenylene sulfide (PPS), polycyclohexylenedimethylene terephthalate (PCT), and polyphthalamide (PPA) and nylon 46. In comparison to LCP, these engineering resins take longer manufacturing cycles and can produce components restricted to 0.25mm thickness. Increasing demand for lightweight and high-performance material in order to improve automobile fuel-efficiency is expected to drive demand. Automobile weight reduction is witnessed as a priority in automobile industry as it lowers carbon footprints into the atmosphere. Stringent environmental regulations in regions of North America and Europe result in lower CO2 emissions. Reducing vehicle weight by 450 kg enables an average weight reduction of 40g of CO2 and increases fuel-efficiency by 8-12%. It is extensively used for under the hood sensors and controllers in automobiles. LCP along with heat resistance properties also attributes chemical resistance required to stand up against mixed gasoline-alcohol fuels and corrosive fumes. Factors related to low-weld strength and warpage are anticipated to restrict industry participant’s growth. Increase in investments in technology for developing products used in niche applications is expected to open up new growth avenues for industry participants.Europe liquid crystal polymer market size, by application, 2012-2020 (Kilo tons)Application Overview Electrical and electronics applications were valued over USD 500 million in 2013. This application is expected to grow at significant growth rates over the forecast period owing to manufacturing electrical components with high-pin density which includes connectors. It is also used for manufacturing electrical components such as NASA’s electronic components for satellite, LEDs, high-density circuit board for missile & weaponry, high-speed digital circuit packaging board. Industrial machinery was the second largest application and accounted for over 6% of the total demand in 2013. Automotive application accounted for over 5% of the total volume in 2013 and is expected to grow at a CAGR of 6.8% from 2014 to 2020. Increasing application scope in growing automobile production is expected to drive the demand. Regional Overview China liquid crystal polymer market revenue was estimated at over USD 300 million in 2013. Presence of large number of multi-scale electronics & electrical industry is expected to consume high volume of LCP over the forecast period. Rest of Asia Pacific (RoAPAC) countries such as India, Indonesia, South Korea and Thailand are expected to witness gains at over 9% over the forecast period. RoAPAC is expected to grow owing to increase in consumers electronics & automobile demand coupled with increasing middle class disposable income. North America liquid crystal polymer market accounted for over 20% of the total demand in 2013 and is expected to grow at moderate growth rates at a CAGR of over 8% from 2014 to 2020. Competitive Market Share The global liquid crystal polymer market share is highly consolidated, with the top four companies accounting over 85% of the total volume in 2013. Industry participants are expected to increase LCP production capacity over the forecast period owing to growing electronics and automotive components demand. Celanese Corporation emerged as the leading company in the global market and accounted for over 30% of the total volume in 2013. Polyplastics, a joint venture between Daicel Corporation and Celanese Corporation accounted for over 25% of the total volume in 2013. Sumitomo Chemical and Solvay S.A together accounted for a significant chunk of the industry in 2013. Other companies include Toray International, Inc., Shanghai PRET Composites Co., Ltd, Samsung Fine Chemicals and Ueno Fine Chemicals.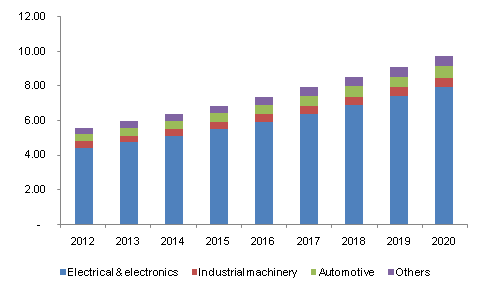
 Table of Contents

Chapter 1. Executive Summary
                1.1. Liquid Crystal Polymers (LCP)– Industry Summary and Critical Success Factors (CSFs)

Chapter 2. Liquid Crystal Polymers (LCP) Industry Outlook
                2.1. Market Segmentation
                2.2. Market Size and Growth Prospects
                2.3. LCP Value Chain Analysis
                2.4. LCP Market Dynamics
                    2.4.1. Market driver analysis
                        2.4.1.1. Increasing miniaturization of electrical components
                        2.4.1.2. Automobile industry growth
                    2.4.2. Market restraint analysis
                        2.4.2.1. Warpage and low welding strength
                2.5. Key Opportunities Prioritized
                2.6. LCP company Market Share Analysis, 2013
                2.7. Industry Analysis - Porter's
                2.8. LCP Market PESTEL Analysis, 2013

Chapter 3. Liquid Crystal Polymers (LCP) Application Outlook
                3.1. Global LCP Market Share by Application, 2013 & 2020
                3.2. Electronics & Electrical
                    3.2.1. Market estimates and forecast, 2012 – 2020, (Kilo Tons) (USD Million)
                    3.2.2. Market estimates and forecast by region, 2012 – 2020 (Kilo Tons) (USD Million)
                3.3. Industrial Machinery
                    3.3.1. Market estimates and forecast, 2012 – 2020, (Kilo Tons) (USD Million)
                    3.3.2. Market estimates and forecast by region, 2012 – 2020 (Kilo Tons) (USD Million)
                3.4. Automotive
                    3.4.1. Market estimates and forecast, 2012 – 2020, (Kilo Tons) (USD Million)
                    3.4.2. Market estimates and forecast by region, 2012 – 2020 (Kilo Tons) (USD Million)
                3.5. Others
                    3.5.1. Market estimates and forecast, 2012 – 2020, (Kilo Tons) (USD Million)
                    3.5.2. Market estimates and forecast by region, 2012 – 2020 (Kilo Tons) (USD Million)

Chapter 4. Liquid Crystal Polymers (LCP) Regional Outlook
                4.1. Global LCP Market Share by Region, 2012-2020
                4.2. North America
                    4.2.1. Market estimates and forecast, 2012 – 2020, (Kilo Tons) (USD Million)
                    4.2.2. Market estimates and forecast by application, 2012 – 2020 (Kilo Tons) (USD Million)
                4.3. Europe
                    4.3.1. Market estimates and forecast, 2012 – 2020, (Kilo Tons) (USD Million)
                    4.3.2. Market estimates and forecast by application, 2012 – 2020 (Kilo Tons) (USD Million)
                4.4. China
                    4.4.1. Market estimates and forecast, 2012 – 2020, (Kilo Tons) (USD Million)
                    4.4.2. Market estimates and forecast by application, 2012 – 2020 (Kilo Tons) (USD Million)
                4.5. Rest of Asia Pacific
                    4.5.1. Market estimates and forecast, 2012 – 2020, (Kilo Tons) (USD Million)
                    4.5.2. Market estimates and forecast by application, 2012 – 2020 (Kilo Tons) (USD Million)

Chapter 5. Competitive Landscape
                5.1. Polyplastics Co., Ltd
                    5.1.1. Company Overview
                    5.1.2. Financial Performance
                    5.1.3. Product Benchmarking
                    5.1.4. Strategic Initiatives
                5.2. Celanese Corporation
                    5.2.1. Company Overview
                    5.2.2. Financial Performance
                    5.2.3. Product Benchmarking
                    5.2.4. Strategic Initiatives
                5.3. Sumitomo Chemical
                    5.3.1. Company Overview
                    5.3.2. Financial Performance
                    5.3.3. Product Benchmarking
                    5.3.4. Strategic Initiatives
                5.4. Solvay S.A.
                    5.4.1. Company Overview
                    5.4.2. Financial Performance
                    5.4.3. Product Benchmarking
                    5.4.4. Strategic Initiatives
                5.5. Toray International, Inc.
                    5.5.1. Company Overview
                    5.5.2. Financial Performance
                    5.5.3. Product Benchmarking
                    5.5.4. Strategic Initiatives
                5.6. Ueno Fine Chemicals Industry Ltd.
                    5.6.1. Company Overview
                    5.6.2. Financial Performance
                    5.6.3. Product Benchmarking
                    5.6.4. Strategic Initiatives
                5.7. Samsung Fine Chemicals
                    5.7.1. Company Overview
                    5.7.2. Financial Performance
                    5.7.3. Product Benchmarking
                    5.7.4. Strategic Initiatives
                5.8. Shanghai PRET Composites Co., Ltd
                    5.8.1. Company Overview
                    5.8.2. Financial Performance
                    5.8.3. Product Benchmarking
                    5.8.4. Strategic Initiatives

Chapter 6. Methodology and Scope
                6.1. Research Methodology
                6.2. Research Scope & Assumptions
                6.3. List of Data Sources Adhesive and Sealant
List of Tables

1. LCP – Industry Summary & Critical Success Factors (CSFs)
2. Global LCP market estimates and forecast, 2012 – 2020 (Tons) (USD Million)
3. Global LCP market volumes estimates and forecast by region, 2012 – 2020 (Kilo Tons)
4. Global LCP market revenue estimates and forecast by region, 2012 – 2020 (USD Million)
5. Global LCP market volume estimates and forecast by application, 2012 – 2020 (Kilo Tons)
6. Global LCP market revenue estimates and forecast by application, 2012 – 2020 (USD Million)
7. LCP – Key market driver analysis
8. LCP – Key market restraint analysis
9. LCP market estimates and forecast from electronics & electrical, 2012 – 2020 (Kilo Tons) (USD Million)
10. LCP volume estimates and forecast from electronics & electrical by region, 2012 – 2020 (Kilo Tons)
11. LCP revenue estimates and forecast from electronics & electrical by region, 2012 – 2020 (USD Million)
12. LCP market estimates and forecast from industrial machinery, 2012 – 2020 (Kilo Tons) (USD Million)
13. LCP market volume estimates and forecast from industrial machinery by region, 2012 – 2020 (Kilo Tons)
14. LCP market revenue estimates and forecast from industrial machinery by region, 2012 – 2020 (USD Million)
15. LCP market estimates and forecast from automotives, 2012 – 2020 (Kilo Tons) (USD Million)
16. LCP market volume estimates and forecast from automotives by region, 2012 – 2020 (Kilo Tons)
17. LCP market revenue estimates and forecast from automotives by region, 2012 – 2020 (USD Million)
18. LCP market estimates and forecast from other applications, 2012 – 2020 (Kilo Tons) (USD Million)
19. LCP market volume estimates and forecast from other applications by region, 2012 – 2020 (Kilo Tons)
20. LCP market revenue estimates and forecast from other applications by region, 2012 – 2020 (USD Million)
21. LCP market estimates and forecast in furniture & interiors industry, 2012 – 2020 (Kilo Tons) (USD Million)
22. North America LCP market estimates and forecast, 2012 – 2020 (Kilo Tons) (USD Million)
23. North America LCP market volume estimates and forecast by application, 2012-2020 (Kilo Tons)
24. North America LCP market revenue estimates and forecast by application, 2012-2020 (USD Million)
25. Europe LCP market estimates and forecast, 2012 – 2020 (Kilo Tons) (USD Million)
26. Europe LCP market volume estimates and forecast by application, 2012-2020 (Kilo Tons)
27. Europe LCP market revenue estimates and forecast by application, 2012-2020 (USD Million)
28. China LCP market estimates and forecast, 2012 – 2020 (Kilo Tons) (USD Million)
29. China LCP market volume estimates and forecast by product, 2012-2020 (Kilo Tons)
30. China LCP market revenue estimates and forecast by product, 2012-2020 (USD Million)
31. Rest of Asia Pacific LCP market estimates and forecast, 2012 – 2020 (Kilo Tons) (USD Million)
32. Rest of Asia Pacific LCP market volume estimates and forecast by application, 2012-2020 (Kilo Tons)
33. Rest of Asia Pacific LCP market revenue estimates and forecast by application, 2012-2020 (USD


List of Figures

1.	LCP market segmentation
2.	Global LCP market estimates and forecasts, 2012 – 2020 (USD Million)
3.	LCP - Value Chain Analysis
4.	LCP - Market Dynamics
5.	LCP-Company market share analysis, 2013
6.	Key Opportunities - Prioritized
7.	LCP – Porter’s Analysis
8.	LCP – PESTEL Analysis
9.	Global LCP market volume share by application, 2013 & 2020
10.	Global LCP market volume share by region, 2013 & 2020

Speak to the report author to design an exclusive study to serve your research needs.
Your personal and confidential information is safe and secure.

