Toll Free: 1-888-928-9744
Toll Free: 1-888-928-9744

Published: Oct, 2015 | Pages:
112 | Publisher: Radiant Insights Inc.
Industry: Transport And Logistics | Report Format: Electronic (PDF)
The Reports Contains Intelligent Transportation System (ITS) Market Size By Application (Road Safety and Security, Traffic Management, Freight Management, Parking Management, Public Transport, Environment Protection, Road User Charging, Automotive Telematics), By Product (ATMS, ATPS, ATIS, APTS, Cooperative vehicle systems), Competitive Analysis & Forecast To 2020 Industry Overview Global Intelligent Transportation System (ITS) market size is likely to attain over USD 38,500 million by 2020, growing at 13% over the next six years. Performance enhancement of transportation systems coupled with need for road safety is expected to drive intelligent transportation system market growth over the forecast period. Several initiatives are being undertaken in order to deploy advanced traffic management systems and overall awareness regarding the importance of road safety. This is expected to drive demand for vehicle to infrastructure (V2I) and vehicle to vehicle (V2V) during the next few years. ATPS was valued USD 5,000 million in 2014 and is likely to attain USD 10,500 million by 2020, growing at CAGR of 13% over 2014 to 2020. Intelligent transportation system enhances the supply chain process performance and yield high cost ratio. Deployment of intelligent transportation system has granted economic benefits in emerging nations such as Brazil, Russia, India, China and South Africa. The system assists the users in reducing overall fuel consumption and travel time by avoiding congested routes. Key manufacturers in established and emerging industries are installing these systems in their vehicles to differentiate their products from competitors. Developed markets of Europe and North America have mandated the usage of electronic stability control (ESC) systems, a driver assistance system, in passenger as well as commercial vehicles. This is expected to favorably impact ITS market growth. Increasing death due to road traffic has lead to high cost incurred and may even account for close to 2% of a country’s GDP. The impact on economic development is particularly acute in middle and low income countries. As a result, there is strong focus on deployment of advanced traffic systems and reducing the number of road accidents. Need for interoperability is expected to hamper industry growth over the forecast period. Interoperability is a major issue for electronic toll collection systems (ETC), on account of the difference in toll collection technologies used by operators across numerous regions. For instance, in Europe, (DSRC) technology and GPS/GSM is employed for ETC systems for toll collection on highways. However, this restraint is expected to be minimized by increasing standardization in ITS and services.U.S. intelligent transportation system market size by product, 2012-2020 (USD million)Product Overview ATMS market size was valued USD 7,000 million in 2014, and was the foremost product segment. It is liable to observe considerable gains, with forecast of USD 15,000 million. ATMS helps in detecting accidents, roadway hazards and dangerous weather conditions. It also creates a holistic integrated view of overall traffic flow. They are integrated with existing traffic control systems that mainly help reduce congestion and ensure efficient use of road space. APTS increases the efficiency and enhances overall safety. It was likely to reach USD 4,500 million by 2020, at a CAGR of 13.7% from 2014 to 2020. Its applications include real-time passenger information systems, bus arrival notification systems and automatic vehicle location systems which are projected to excite the industry growth. Application Overview Traffic management system includes vehicle detection systems, bridge traffic management systems and ramp metering. It leads the global ITS market, accounted for about 30% of the total share in 2014, with gains estimated at 12% over the next six years. The system enhances reliability and operation performance of road networks. Road user charging was anticipated to reach over USD 8,000 million by 2020, growing at a CAGR of over 12% over the forecast period. This segment is expected to dominate the intelligent transportation system market, owing to development of new technology solutions such as high-occupancy toll (HOT) lanes and vehicle miles travelled (VMT). Regional Overview North America ITS market was valued over USD 8,000 million in 2014. It is expected to reach USD 16,000 million by 2020 at a CAGR of 12% over the forecast period. Government initiatives along with promotional activities have spurred the demand growth in this region. Europe was anticipated to attain USD 9,500 million by 2020, with gains estimated of 12% over the next few years. The European commission has taken initiatives to make investments such as eSafety, EasyWay and Galileo among others which is further expected to stimulate the demand growth. Asia Pacific intelligent transportation system market was valued over USD 4,000 million in 2014 and is likely to attain USD 9,500 million by 2020. The region is predictable to grow at elevated growth rate owing to advancements in sensor technologies in the region. Increasing need for sensors that can be integrated into handheld devices coupled with government legislations including the Industrial Safety, Wealth and Welfare Act are expected to fuel regional industry growth. Competitive Market Share The global ITS market share is fairly competitive, with the top ten major participants accounting majority of shares in 2013. The key companies namely Siemens AG, Kapsch TrafficCom, Hitachi Ltd., SWARCO AG, Q-Free ASA, TomTom NV, Denso, Garmin International, Xerox Corp. and IBM Corp.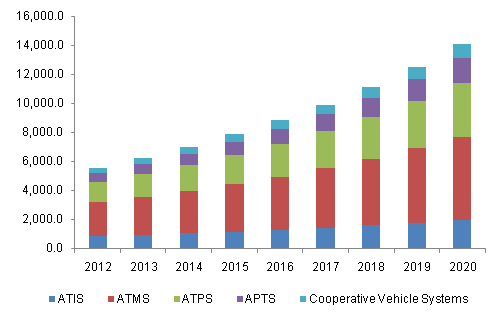
 Table of Contents

Chapter 1	Executive Summary

Chapter 2	ITS Industry Overview
2.1	Market segmentation
2.2	Market Size and Growth Prospects
2.3	ITS - Value Chain Analysis
2.4	ITS – Market dynamics
2.4.1	Market driver analysis
2.4.1.1	Need for road safety
2.4.1.2	Performance enhancement of transportation systems
2.4.1.3	Cost effectiveness
2.4.2	Market restraint analysis
2.4.2.1	Need for interoperability
2.5	Key opportunities - Prioritized
2.6	Industry Analysis – Porter’s
2.7	ITS - Key competitor ranking, 2013
2.8	ITS – PESTEL Analysis

Chapter 3	ITS Product Overview
3.1	ITS market share by product, 2013 & 2020
3.2	ATIS
3.3	ATMS
3.4	ATPS
3.5	APTS
3.6	Cooperative vehicle systems

Chapter 4	ITS Application Overview
4.1	ITS market share by application, 2013 & 2020
4.2	Traffic Management
4.3	Road Safety and Security
4.4	Freight Management (Commercial)
4.5	Public Transport
4.6	Environment Protection
4.7	Automotive Telematics
4.8	Parking Management
4.9	Road User Charging

Chapter 5	ITS Regional Overview
5.1	ITS market share by region, 2013 & 2020
5.2	North America
5.2.1	North America ITS market by product, 2012 – 2020
5.2.2	North America ITS market by application, 2012 – 2020
5.2.3	U.S.
5.2.3.1	U.S. ITS market by product, 2012 – 2020
5.2.3.2	U.S. ITS market by application, 2012 – 2020
5.3	Europe
5.3.1	Europe ITS market by product, 2012 – 2020
5.3.2	Europe ITS market by application, 2012 – 2020
5.3.3	Germany
5.3.3.1	Germany ITS market by product, 2012 – 2020
5.3.3.2	Germany ITS market by application, 2012 – 2020
5.3.4	France
5.3.4.1	France ITS market by product, 2012 – 2020
5.3.4.2	France ITS market by application, 2012 – 2020
5.3.5	Italy
5.3.5.1	Italy ITS market by product, 2012 – 2020
5.3.5.2	Italy ITS market by application, 2012 – 2020
5.3.6	UK
5.3.6.1	UK ITS market by product, 2012 – 2020
5.3.6.2	UK ITS market by application, 2012 – 2020
5.4	Asia Pacific
5.4.1	Asia Pacific ITS market by product, 2012 – 2020
5.4.2	Asia Pacific ITS market by application, 2012 – 2020
5.4.3	China
5.4.3.1	China ITS market by product, 2012 – 2020
5.4.3.2	China ITS market by application, 2012 – 2020
5.4.4	India
5.4.4.1	India ITS market by product, 2012 – 2020
5.4.4.2	India ITS market by application, 2012 – 2020
5.4.5	Japan
5.4.5.1	Japan ITS market by product, 2012 – 2020
5.4.5.2	Japan ITS market by application, 2012 – 2020
5.5	RoW
5.5.1	RoW ITS market by product, 2012 – 2020
5.5.1.1	RoW ITS market by application, 2012 – 2020

Chapter 6	Competitive Landscape
6.1	ADCCO LLC
6.1.1	Company Overview
6.1.2	Financial Performance
6.1.3	Product Benchmarking
6.1.4	Strategic Initiatives
6.2	Agero Inc.
6.2.1	Company Overview
6.2.2	Financial Performance
6.2.3	Product Benchmarking
6.2.4	Strategic Initiatives
6.3	DENSO Corporation
6.3.1	Company Overview
6.3.2	Financial Performance
6.3.3	Product Benchmarking
6.3.4	Strategic Initiatives
6.4	EFKON AG
6.4.1	Company Overview
6.4.2	Financial Performance
6.4.3	Product Benchmarking
6.4.4	Strategic Initiatives
6.5	Hitachi Ltd
6.5.1	Company Overview
6.5.2	Financial Performance
6.5.3	Product Benchmarking
6.5.4	Strategic Initiatives
6.6	Nuance Communications
6.6.1	Company Overview
6.6.2	Financial Performance
6.6.3	Product Benchmarking
6.6.4	Strategic Initiatives
6.7	Garmin International Inc.
6.7.1	Company Overview
6.7.2	Financial Performance
6.7.3	Product Benchmarking
6.7.4	Strategic Initiatives
6.8	Iteris, Inc.
6.8.1	Company Overview
6.8.2	Financial Performance
6.8.3
6.8.4	Product Benchmarking
6.8.5	Strategic Initiatives
6.9	Kapsch TrafficCom AG
6.9.1	Company Overview
6.9.2	Financial Performance
6.9.3	Product Benchmarking
6.9.4	Strategic Initiatives
6.10	Lanner Electronics Inc.
6.10.1	Company Overview
6.10.2	Financial Performance
6.10.3	Product Benchmarking
6.10.4	Strategic Initiatives
6.11	Q-Free ASA
6.11.1	Company Overview
6.11.2	Financial Performance
6.11.3	Product Benchmarking
6.11.4	Strategic Initiatives
6.12	Ricardo PLC
6.12.1	Company Overview
6.12.2	Financial Performance
6.12.3	Product Benchmarking
6.12.4	Strategic Initiatives
6.13	Sensys Networks Incorporation
6.13.1	Company Overview
6.13.2	Financial Performance
6.13.3	Product Benchmarking
6.13.4	Strategic Initiatives
6.14	Siemens AG
6.14.1	Company Overview
6.14.2	Financial Performance
6.14.3	Product Benchmarking
6.14.4	Strategic Initiatives
6.15	Telenav, Inc.
6.15.1	Company Overview
6.15.2	Financial Performance
6.15.3	Product Benchmarking
6.15.4	Strategic Initiatives
6.16	Thales Group
6.16.1	Company Overview
6.16.2	Financial Performance
6.16.3	Product Benchmarking
6.16.4	Strategic Initiatives
6.17	TomTom NV
6.17.1	Company Overview
6.17.2	Financial Performance
6.17.3	Product Benchmarking
6.17.4	Strategic Initiatives
6.18	TransCore Inc.
6.18.1	Company Overview
6.18.2	Financial Performance
6.18.3	Product Benchmarking
6.18.4	Strategic Initiatives
6.19	WS Atkins PLC
6.19.1	Company Overview
6.19.2	Financial Performance
6.19.3	Product Benchmarking
6.19.4	Strategic Initiatives
6.20	Xerox Corporation
6.20.1	Company Overview
6.20.2	Financial Performance
6.20.3	Product Benchmarking
6.20.4	Strategic Initiatives

Chapter 7	Methodology and Scope
7.1	Research Methodology
7.2	Research Scope & Assumptions
7.3	List of Data Sources
List of Tables

TABLE 1	ITS  – Industry Summary & Critical Success Factors (CSFs)
TABLE 2	Global ITS market revenue, (USD Million), 2012 - 2020
TABLE 3	Global ITS market revenue by region, (USD Million), 2012 - 2020
TABLE 4	Global ITS market revenue by product, (USD Million), 2012 - 2020
TABLE 5	Global ITS market revenue by application, (USD Million), 2012 - 2020
TABLE 6	ITS – Key market driver impact
TABLE 7	ITS – Key market restraint impact
TABLE 8	Global ATIS market demand (USD Million), 2012 - 2020
TABLE 9	Global ATIS market demand by region (USD Million), 2012 - 2020
TABLE 10	Global ATMS market demand (USD Million), 2012 - 2020
TABLE 11	Global ATMS market demand by region (USD Million), 2012 - 2020
TABLE 12	Global ATPS market demand (USD Million), 2012 - 2020
TABLE 13	Global ATPS market demand by region (USD Million), 2012 - 2020
TABLE 14	Global APTS market demand (USD Million), 2012 - 2020
TABLE 15	Global APTS market demand by region (USD Million), 2012 - 2020
TABLE 16	Global cooperative vehicle systems market demand (USD Million), 2012 - 2020
TABLE 17	Global cooperative vehicle systems market demand by region (USD Million), 2012 - 2020
TABLE 18	Global ITS market demand in traffic management (USD Million), 2012 - 2020
TABLE 19	Global ITS market demand in traffic management by region (USD Million), 2012 - 2020
TABLE 20	Global ITS market demand in road safety and security (USD Million), 2012 - 2020
TABLE 21	Global ITS market demand in road safety and security by region (USD Million), 2012 - 2020
TABLE 22	Global ITS market demand in freight management (commercial) (USD Million), 2012 - 2020
TABLE 23	Global ITS market demand in freight management (commercial) by region (USD Million), 2012 - 2020
TABLE 24	Global ITS market demand in public transport (USD Million), 2012 - 2020
TABLE 25	Global ITS market demand in public transport by region (USD Million), 2012 - 2020
TABLE 26	Global ITS market demand in environment protection (USD Million), 2012 - 2020
TABLE 27	Global ITS market demand in environment protection by region (USD Million), 2012 - 2020
TABLE 28	Global ITS market demand in automotive telematics (USD Million), 2012 - 2020
TABLE 29	Global ITS market demand in automotive telematics by region (USD Million), 2012 - 2020
TABLE 30	Global ITS market demand in parking management (USD Million), 2012 - 2020
TABLE 31	Global ITS market demand in parking management by region (USD Million), 2012 - 2020
TABLE 32	Global ITS market demand in road user charging (USD Million), 2012 - 2020
TABLE 33	Global ITS market demand in road user charging by region (USD Million), 2012 - 2020
TABLE 34	North America ITS market by product (USD Million), 2012 – 2020
TABLE 35	North America ITS market by application (USD Million), 2012 – 2020
TABLE 36	U.S. ITS market by product (USD Million), 2012 – 2020
TABLE 37	U.S. ITS market by application (USD Million), 2012 – 2020
TABLE 38	Europe ITS market by product (USD Million), 2012 – 2020
TABLE 39	Europe ITS market by application (USD Million), 2012 – 2020
TABLE 40	Germany ITS market by product (USD Million), 2012 – 2020
TABLE 41	Germany ITS market by application (USD Million), 2012 – 2020
TABLE 42	France ITS market by product (USD Million), 2012 – 2020
TABLE 43	France ITS market by application (USD Million), 2012 – 2020
TABLE 44	Italy ITS market by product (USD Million), 2012 – 2020
TABLE 45	Italy ITS market by application (USD Million), 2012 – 2020
TABLE 46	UK ITS market by product (USD Million), 2012 – 2020
TABLE 47	UK ITS market by application (USD Million), 2012 – 2020
TABLE 48	Asia Pacific ITS market by product (USD Million), 2012 – 2020
TABLE 49	Asia Pacific ITS market by application (USD Million), 2012 – 2020
TABLE 50	China ITS market by product (USD Million), 2012 – 2020
TABLE 51	China ITS market by application (USD Million), 2012 – 2020
TABLE 52	India ITS market by product (USD Million), 2012 – 2020
TABLE 53	India ITS market by application (USD Million), 2012 – 2020
TABLE 54	Japan ITS market by product (USD Million), 2012 – 2020
TABLE 55	Japan ITS market by application (USD Million), 2012 – 2020
TABLE 56	RoW ITS market by product (USD Million), 2012 – 2020
TABLE 57	RoW ITS market by application (USD Million), 2012 – 2020

List of Figures

FIG. 1	ITS Market Segmentation
FIG. 2	Global ITS market revenue, (USD Million), 2012 - 2020
FIG. 3	ITS Value Chain Analysis
FIG. 4	ITS Market Dynamics
FIG. 5	Road traffic death rate, 2012
FIG. 6	Key Opportunities Prioritized
FIG. 7	ITS – Porter’s Analysis
FIG. 8	ITS – PESTEL Analysis
FIG. 9	ITS market share by product, 2013 & 2020
FIG. 10	Global ATIS market demand (USD Million), 2012 – 2020
FIG. 11	Global ATMS market demand (USD Million), 2012 – 2020
FIG. 12	Global ATPS market demand (USD Million), 2012 – 2020
FIG. 13	Global APTS market demand (USD Million), 2012 – 2020
FIG. 14	Global cooperative vehicle systems market demand (USD Million), 2012 – 2020
FIG. 15	ITS market share by application, 2013 & 2020
FIG. 16	Global ITS market demand in traffic management (USD Million), 2012 – 2020
FIG. 17	Global ITS market demand in road safety and security (USD Million), 2012 - 2020
FIG. 18	Global ITS market demand in freight management (USD Million), 2012 - 2020
FIG. 19	Global ITS market demand in public transport (USD Million), 2012 - 2020
FIG. 20	Global ITS market demand in environment protection (USD Million), 2012 – 2020
FIG. 21	Global ITS market demand in automotive telematics (USD Million), 2012 – 2020
FIG. 22	Global ITS market demand in parking management (USD Million), 2012 – 2020
FIG. 23	Global ITS market demand in road user charging (USD Million), 2012 - 2020
FIG. 24	ITS market share by region, 2013 & 2020
FIG. 25	North America ITS market by product (USD Million), 2012 – 2020
FIG. 26	North America ITS market by application (USD Million), 2012 – 2020
FIG. 27	U.S. ITS market by product (USD Million), 2012 – 2020
FIG. 28	U.S. ITS market by application (USD Million), 2012 – 2020
FIG. 29	Europe ITS market by product (USD Million), 2012 – 2020
FIG. 30	Europe ITS market by application (USD Million), 2012 – 2020
FIG. 31	Germany ITS market by product (USD Million), 2012 – 2020
FIG. 32	Germany ITS market by application (USD Million), 2012 – 2020
FIG. 33	France ITS market by product (USD Million), 2012 – 2020
FIG. 34	France ITS market by application (USD Million), 2012 – 2020
FIG. 35	Italy ITS market by product (USD Million), 2012 – 2020
FIG. 36	Italy ITS market by application (USD Million), 2012 – 2020
FIG. 37	UK ITS market by product (USD Million), 2012 – 2020
FIG. 38	UK ITS market by application (USD Million), 2012 – 2020
FIG. 39	Asia Pacific ITS market by product (USD Million), 2012 – 2020
FIG. 40	Asia Pacific ITS market by application (USD Million), 2012 – 2020
FIG. 41	China ITS market by product (USD Million), 2012 – 2020
FIG. 42	China ITS market by application (USD Million), 2012 – 2020
FIG. 43	India ITS market by product (USD Million), 2012 – 2020
FIG. 44	India ITS market by application (USD Million), 2012 – 2020
FIG. 45	Japan ITS market by product (USD Million), 2012 – 2020
FIG. 46	Japan ITS market by application (USD Million), 2012 – 2020
FIG. 47	RoW ITS market by product (USD Million), 2012 – 2020
FIG. 48	RoW ITS market by application (USD Million), 2012 – 2020

Speak to the report author to design an exclusive study to serve your research needs.
Your personal and confidential information is safe and secure.

