Toll Free: 1-888-928-9744
Toll Free: 1-888-928-9744

Published: Oct, 2015 | Pages:
180 | Publisher: Radiant Insights Inc.
Industry: Petrochemicals | Report Format: Electronic (PDF)
The Report Contains Heat Transfer Fluids Market Size By Application (Chemical Industry, Oil & Gas, Food & Beverages, Concentrated Solar Power (CSP), Pharmaceuticals, Plastics, HVAC), By Product (Mineral Oils, Silicones & Aromatics, Glycol), Competitive Analysis & Forecast, 2012 - 2022 Industry Overview Global heat transfer fluids market size is expected to reach 745.3 kilo tons by 2022, growing at a CAGR of 6.1% from 2015 to 2022. Growing demand to be used as a heating utility coupled with heat recovery management in industries such as pharmaceuticals, metal processing, food processing and automotive is anticipated to drive the heat transfer fluids market growth. Increasing concentrated solar power (CSP) plants installations in countries such as the U.S., China and France are anticipated to drive heat transfer Fluids industry. Global CSP capacity was 436.0 MW in 2008 which increased to 3320 MW in 2014 and witnessed CAGR of 40.1% in the duration period. Thermic fluids play a significant role in improving efficiency of CSP plants. Owing to enhanced thermal properties of these fluids, they have high heat storage capabilities which in turn increases the overall power generation capacity of the plant. The U.S. and Spain are leading regional markets and are estimated to witness significant growth with rapid development of existing CSP projects. Spain has advantages of localized resources and along with favorable policy framework it is expected to reach a capacity of 4.0 GW by 2015. Growing gas production in GCC is anticipated to fuel synthetic lubricants demand in the form of heat transfer fluids over the next seven years. GCC natural gas production was 207.5 BCM in 2005 and it reached 369.2 BCM by 2012. Application growth in construction, automotive, personal care and food & beverage industries in emerging economies of Middle East countries such as Qatar, Saudi Arabia, and UAE, has shifted the national governments’ focus towards natural gas development Approval of using thermic fluids in food & beverages applications by various regulatory bodies is likely to favor its demand. The ingredients of food grade heat transfer fluid are now approved by USDA by HT1 applications (thermic fluids with incidental food contact). These fluids comply with all the requirements of FDA 178.3570. Stringent environmental regulations by EPA and REACH coupled with tight raw material supply situation (base oil, crude oil) are anticipated to hinder industry growth. Increasing investments to develop water based or bio based heat transfer fluid is likely to provide growth opportunities.Germany heat transfer fluids market size, by application, 2012-2022 (Kilo Tons)Product Overview Silicon & aromatics was the dominant product segment and amounted to over USD 900 million in 2014. Growth of oil & gas and chemical industries are expected to drive the product demand. They are widely preferred in industries such as plastics, wood processes spin & weave, food and chemical. Mineral oils accounted to over 40% of the total volume in 2014 and are anticipated to witness gains at CAGR above 5.5% from 2015 to 2022. Growing food & beverage and cosmetics industry in Europe and Asia Pacific is anticipated to drive growth over the forecast period. Application Overview Oil & gas applications were the largest with a valuation of over USD 450 million in 2014. Thermic fluids are used in offshore heating and cooling processes in oil and gas platform utilities and floating production units. They are used in LNG in liquefaction and re-gasification terminals. CSP applications accounted for over 15% of the total volume in 2014 and are anticipated to witness highest gains at an estimated CAGR of over 7% from 2015 to 2022. Thermic fluid is circulated to the solar field through a heat exchanger, resulting in conventional steam cycle. Growing CSP industry in Asia Pacific and Europe is likely to drive the demand. Regional Overview Europe heat transfer fluids market was the dominant region with revenue generation estimated over USD 650 million in 2014. Recent developments observed in new solar plants coupled with surging energy demand are expected to drive the heat transfer fluid demand in Europe. Increasing requirement in utilizing excessive heat coupled with energy dissipated from major industries which includes HVAC, chemical, CSP plants is likely to drive regional demand. Asia Pacific heat transfer fluids market is likely to witness highest gains at an estimated CAGR of over 6.5% from 2015 to 2022. Growing chemical, food & beverage and oil & gas industry in the region is likely to drive the product demand. Emerging economies such as India, China and Japan are expected to have rapid growth in the product application industries which is anticipated to steer the demand. Competitive Market Share Global heat transfer fluids market share is consolidated with top five companies accounting for over 75% of the market volume in 2014. The Dow Chemical Company dominated the market with a share of over 28% of the total revenue generated in 2014. Major products offered by the company include synthetic fluids and inhibited glycol (ethylene or propylene glycol) fluids. Major companies involved in this market include Eastman Company, ExxonMobil, Bp and Shell Companies are also investing to develop nanofluids accompanied with superior thermal properties and multi-utility for numerous industrial applications.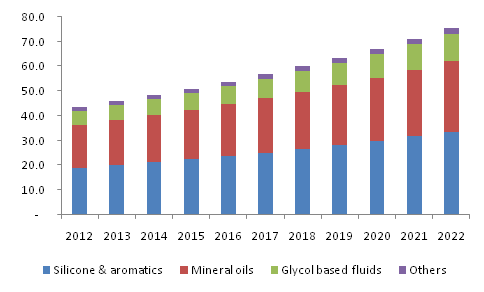
 Table of Content

Chapter 1	Methodology & Scope
1.1	Research Methodology
1.2	Research Scope & Assumptions
1.3	List of Data Sources

Chapter 2	Executive Summary
2.1	Heat Transfer Oil - Industry Summary & Key Buying Criteria

Chapter 3	Heat Transfer Oil Industry Overview
3.1	Market segmentation
3.2	Market size and growth prospects, 2012-2022
3.3	Heat transfer oil value Chain Analysis
3.3.1	Vendor Landscape
3.4	Regulatory/legislative framework
3.5	Raw material trends
3.5.1	Crude oil
3.5.2	Mineral oils
3.5.3	Benzene, toluene, xylene (BTX)
3.6	Heat transfer oil market dynamics
3.6.1	Market driver analysis
3.6.1.1	Growing concentrating solar power (CSP) industry
3.6.1.2	Increased importance of thermal fluid systems over steam systems
3.6.1.3	FDA approval for food grade heat transfer fluids
3.6.1.4	Growing natural gas production in GCC
3.6.2	Market restraint analysis
3.6.2.1	Stringent environment regulations
3.7	Heat transfer oil company market share analysis, 2014
3.8	Key opportunities - Prioritized
3.9	Industry Analysis - Porter’s
3.10	Heat transfer oil PESTEL analysis

Chapter 4	Heat Transfer Oil Product Overview
4.1	Global heat transfer oil market share by product, 2014 & 2022
4.2	Silicones & aromatics
4.2.1	Market estimates and forecast, 2012 – 2022
4.2.2	Market estimates and forecast by region, 2012 - 2022
4.3	Mineral oils
4.3.1	Market estimates and forecast, 2012 – 2022
4.3.2	Market estimates and forecast by region, 2012 - 2022
4.4	Glycol
4.4.1	Market estimates and forecast, 2012 – 2022
4.4.2	Market estimates and forecast by region, 2012 - 2022
4.5	Other
4.5.1	Market estimates and forecast, 2012 – 2022
4.5.2	Market estimates and forecast by region, 2012 - 2022

Chapter 5	Heat Transfer Oil Application Overview
5.1	Global heat transfer oil market volume share by application, 2014 & 2022
5.2	Oil & gas
5.2.1	Market estimates and forecast, 2012 – 2022
5.2.2	Market estimates and forecast by region, 2012 - 2022
5.3	Chemical industry
5.3.1	Market estimates and forecast, 2012 – 2022
5.3.2	Market estimates and forecast by region, 2012 - 2022
5.4	Concentrated Solar Power (CSP)
5.4.1	Market estimates and forecast, 2012 – 2022
5.4.2	Market estimates and forecast by region, 2012 – 2022
5.5	Food & beverages
5.5.1	Market estimates and forecast, 2012 – 2022
5.5.2	Market estimates and forecast by region, 2012 – 2022
5.6	Plastics
5.6.1	Market estimates and forecast, 2012 – 2022
5.6.2	Market estimates and forecast by region, 2012 – 2022
5.7	Pharmaceuticals
5.7.1	Market estimates and forecast, 2012 – 2022
5.7.2	Market estimates and forecast by region, 2012 – 2022
5.8	Heating, ventilation & air conditioning (HVAC)
5.8.1	Market estimates and forecast, 2012 – 2022
5.8.2	Market estimates and forecast by region, 2012 – 2022
5.9	Others
5.9.1	Market estimates and forecast, 2012 – 2022
5.9.2	Market estimates and forecast by region, 2012 – 2022

Chapter 6	Heat Transfer Oil Regional Overview
6.1	Global heat transfer oil market volume share by region, 2014 & 2022
6.2	North America
6.2.1	Market estimates and forecast, 2012 – 2022
6.2.2	Market estimates and forecast by product, 2012 – 2022
6.2.3	Market estimates and forecast by application, 2012 – 2022
6.2.4	U.S.
6.2.4.1	Market estimates and forecast, 2012 – 2022
6.2.4.2	Market estimates and forecast by product, 2012 – 2022
6.2.4.3	Market estimates and forecast by application, 2012 – 2022
6.2.5	Canada
6.2.5.1	Market estimates and forecast, 2012 – 2022
6.2.5.2	Market estimates and forecast by product, 2012 – 2022
6.2.5.3	Market estimates and forecast by application, 2012 – 2022
6.3	Europe
6.3.1	Market estimates and forecast, 2012 – 2022
6.3.2	Market estimates and forecast by product, 2012 – 2022
6.3.3	Market estimates and forecast by application, 2012 – 2022
6.3.4	Germany
6.3.4.1	Market estimates and forecast, 2012 – 2022
6.3.4.2	Market estimates and forecast by product, 2012 – 2022
6.3.4.3	Market estimates and forecast by application, 2012 – 2022
6.3.5	UK
6.3.5.1	Market estimates and forecast, 2012 – 2022
6.3.5.2	Market estimates and forecast by product, 2012 – 2022
6.3.5.3	Market estimates and forecast by application, 2012 – 2022
6.4	Asia Pacific
6.4.1	Market estimates and forecast, 2012 – 2022
6.4.2	Market estimates and forecast by product, 2012 – 2022
6.4.3	Asia Pacific heat transfer oil market estimates and forecast by application, 2012 – 2022
6.4.4	China
6.4.4.1	Market estimates and forecast, 2012 – 2022
6.4.4.2	Market estimates and forecast by product, 2012 – 2022
6.4.4.3	Market estimates and forecast by application, 2012 – 2022
6.4.5	India
6.4.5.1	Market estimates and forecast, 2012 – 2022
6.4.5.2	Market estimates and forecast by product, 2012 – 2022
6.4.5.3	Market estimates and forecast by application, 2012 – 2022
6.4.6	Japan
6.4.6.1	Market estimates and forecast, 2012 – 2022
6.4.6.2	Market estimates and forecast by product, 2012 – 2022
6.4.6.3	Market estimates and forecast by application, 2012 – 2022
6.5	Middle East & Africa
6.5.1	Market estimates and forecast, 2012 – 2022
6.5.2	Market estimates and forecast by product, 2012 – 2022
6.5.3	Market estimates and forecast by application, 2012 – 2022
6.6	Central & South America
6.6.1	Market estimates and forecast, 2012 – 2022
6.6.2	Market estimates and forecast by product, 2012 – 2022
6.6.3	CMarket estimates and forecast by application, 2012 – 2022

Chapter 7	Competitive Landscape
7.1	Dynalene, Inc.
7.1.1	Company Overview
7.1.2	Financial Performance
7.1.3	Product Benchmarking
7.2	Indian Oil Corporation Ltd. (IOCL)
7.2.1	Company Overview
7.2.2	Financial Performance
7.2.3	Product Benchmarking
7.3	KOST USA, Inc.
7.3.1	Company Overview
7.3.2	Financial Performance
7.3.3	Product Benchmarking
7.3.4	Strategic Initiatives
7.4	Hindustan Petroleum Corporation Ltd. (HPCL)
7.4.1	Company Overview
7.4.2	Financial Performance
7.4.3	Product Benchmarking
7.5	CFR Chemicals
7.5.1	Company Overview
7.5.2	Financial Performance
7.5.3	Product Benchmarking
7.6	Inlet Petroleum Company (IPC)
7.6.1	Company Overview
7.6.2	Financial Performance
7.6.3	Product Benchmarking
7.7	British Petroleum (BP)
7.7.1	Company Overview
7.7.2	Financial Performance
7.7.3	Product Benchmarking
7.8	Huntsman Corporation
7.8.1	Company Overview
7.8.2	Financial Performance
7.8.3	Product Benchmarking
7.9	Royal Dutch Shell Plc
7.9.1	Company Overview
7.9.2	Financial Performance
7.9.3	Product Benchmarking
7.10	Eastman Chemical Company
7.10.1	Company Overview
7.10.2	Financial Performance
7.10.3	Product Benchmarking
7.10.4	Strategic Initiatives
7.11	Phillips 66
7.11.1	Company Overview
7.11.2	Financial Performance
7.11.3	Product Benchmarking
7.11.4	Strategic Initiatives
7.12	Chevron Co.
7.12.1	Company Overview
7.12.2	Financial Performance
7.12.3	Product Benchmarking
7.13	BASF SE
7.13.1	Company Overview
7.13.2	Financial Performance
7.13.3	Product Benchmarking
7.13.4	Strategic Initiatives
7.14	Exxon Mobil
7.14.1	Company Overview
7.14.2	Financial Performance
7.14.3	Product Benchmarking
7.15	The Dow Chemical Company
7.15.1	Company Overview
7.15.2	Financial Performance
7.15.3	Product Benchmarking
7.15.4	Strategic Initiatives
List of Tables

TABLE 1	Heat Transfer Fluid - Industry summary & Key Buying Criteria, 2012-2022
TABLE 2	Global heat transfer fluid market estimates, 2012 – 2014, (Kilo Tons) (USD Million)
TABLE 3	Global heat transfer fluid market estimates and forecast, 2015 – 2022, (Kilo Tons) (USD Million)
TABLE 4	Global heat transfer fluid market volume estimates by region, 2012 – 2014, (Kilo Tons)
TABLE 5	Global heat transfer fluid market volume estimates and forecast by region, 2015 – 2022, (Kilo Tons)
TABLE 6	Global heat transfer fluid revenue estimates by region, 2012 – 2014, (Kilo Tons)
TABLE 7	Global heat transfer fluid revenue estimates and forecast by region, 2015 – 2022, (Kilo Tons)
TABLE 8	Global heat transfer fluid market volume estimates by product, 2012– 2014, (Kilo Tons)
TABLE 9	Global heat transfer fluid market volume estimates and forecast by product, 2015– 2022, (Kilo Tons)
TABLE 10	Global heat transfer fluid revenue estimates by product, 2012– 2014, (Kilo Tons)
TABLE 11	Global heat transfer fluid revenue estimates and forecast by product, 2015– 2022, (Kilo Tons)
TABLE 12	Global heat transfer fluid market volume estimates by application, 2012– 2014, (Kilo Tons)
TABLE 13	Global heat transfer fluid market volume estimates and forecast by application, 2015– 2022, (Kilo Tons)
TABLE 14	Global heat transfer fluid revenue estimates by application, 2012– 2014, (USD Million)
TABLE 15	Global heat transfer fluid revenue estimates and forecast by application, 2015– 2022, (USD Million)
TABLE 16	Heat transfer fluid – Key market driver analysis
TABLE 17	Heat transfer fluids – Key market restraint analysis
TABLE 18	Global silicones & aromatics heat transfer fluid market estimates, 2012 – 2014, (Kilo Tons) (USD Million)
TABLE 19	Global silicones & aromatics heat transfer fluid market estimates and forecast, 2015 – 2022, (Kilo Tons) (USD Million)
TABLE 20	Global silicone & aromatic heat transfer fluid market volume estimates by region, 2012 - 2014 (Kilo Tons)
TABLE 21	Global silicones & aromatics heat transfer fluid market volume estimates and forecast by region, 2015 - 2022 (Kilo Tons)
TABLE 22	Global silicones & aromatics heat transfer fluid revenue estimates by region, 2012 - 2014 (USD Million)
TABLE 23	Global silicones & aromatics heat transfer fluid revenue estimates and forecast by region, 2015 - 2022 (USD Million)
TABLE 24	Global mineral heat transfer fluid market estimates, 2012 – 2014, (Kilo Tons) (USD Million)
TABLE 25	Global mineral heat transfer fluid market estimates and forecast, 2015 – 2022, (Kilo Tons) (USD Million)
TABLE 26	Global mineral heat transfer fluid market volume estimates by region, 2012 - 2014 (Kilo Tons)
TABLE 27	Global mineral heat transfer fluid market volume estimates and forecast by region, 2015 - 2022 (Kilo Tons)
TABLE 28	Global mineral heat transfer fluid revenue estimates by region, 2012 - 2014 (USD Million)
TABLE 29	Global mineral heat transfer fluid revenue estimates and forecast by region, 2015 - 2022 (USD Million)
TABLE 30	Global glycol heat transfer fluid market estimates, 2012 – 2014, (Kilo Tons) (USD Million)
TABLE 31	Global glycol heat transfer fluid market estimates and forecast, 2015 – 2022, (Kilo Tons) (USD Million)
TABLE 32	Global glycol heat transfer fluid market volume estimates by region, 2012 - 2014 (Kilo Tons)
TABLE 33	Global glycol heat transfer fluid market volume estimates and forecast by region, 2015 - 2022 (Kilo Tons)
TABLE 34	Global glycol heat transfer fluid revenue estimates by region, 2012 - 2014 (USD Million)
TABLE 35	Global glycol heat transfer fluid revenue estimates and forecast by region, 2015 - 2022 (USD Million)
TABLE 36	Global other heat transfer fluid market estimates, 2012 – 2014, (Kilo Tons) (USD Million)
TABLE 37	Global other heat transfer fluid market estimates and forecast, 2015 – 2022, (Kilo Tons) (USD Million)
TABLE 38	Global other heat transfer fluid market volume estimates by region, 2012 - 2014 (Kilo Tons)
TABLE 39	Global other heat transfer fluid market volume estimates and forecast by region, 2015 - 2022 (Kilo Tons)
TABLE 40	Global other heat transfer fluid revenue estimates by region, 2012 - 2014 (USD Million)
TABLE 41	Global other heat transfer fluid revenue estimates and forecast by region, 2015 - 2022 (USD Million)
TABLE 42	Global heat transfer fluid market estimates in fluid & gas, 2012 – 2014, (Kilo Tons) (USD Million)
TABLE 43	Global heat transfer fluid market estimates and forecast in oil & gas, 2015 – 2022, (Kilo Tons) (USD Million)
TABLE 44	Global heat transfer fluid market volume estimates in oil & gas by region, 2012 - 2014 (Kilo Tons)
TABLE 45	Global heat transfer fluid market volume estimates and forecast in oil & gas by region, 2015 - 2022 (Kilo Tons)
TABLE 46	Global heat transfer fluid revenue estimates in oil & gas by region, 2012 - 2014 (USD Million)
TABLE 47	Global heat transfer fluid revenue estimates and forecast in oil & gas by region, 2015 - 2022 (USD Million)
TABLE 48	Global heat transfer fluid market estimates in chemical industry, 2012 – 2014, (Kilo Tons) (USD Million)
TABLE 49	Global heat transfer fluid market estimates and forecast in chemical industry, 2015 – 2022, (Kilo Tons) (USD Million)
TABLE 50	Global heat transfer fluid market volume estimates in chemical industry by region, 2012 - 2014 (Kilo Tons)
TABLE 51	Global heat transfer fluid market volume estimates and forecast in chemical industry by region, 2015 - 2022 (Kilo Tons)
TABLE 52	Global heat transfer fluid revenue estimates in chemical industry by region, 2012 - 2014 (USD Million)
TABLE 53	Global heat transfer fluid revenue estimates and forecast in chemical industry by region, 2015 - 2022 (USD Million)
TABLE 54	Global heat transfer fluid market estimates in CSP, 2012 – 2014, (Kilo Tons) (USD Million)
TABLE 55	Global heat transfer fluid market estimates and forecast in CSP, 2015 – 2022, (Kilo Tons) (USD Million)
TABLE 56	Global heat transfer fluid market volume in CSP by region, 2012 - 2014 (Kilo Tons)
TABLE 57	Global heat transfer fluid market volume in CSP by region, 2015 - 2022 (Kilo Tons)
TABLE 58	Global heat transfer fluid revenue estimates in CSP by region, 2012 - 2014 (USD Million)
TABLE 59	Global heat transfer fluid revenue in CSP by region, 2015 - 2022 (USD Million)
TABLE 60	Global heat transfer fluid market estimates in food & beverages, 2012 – 2014, (Kilo Tons) (USD Million)
TABLE 61	Global heat transfer fluid market estimates and forecast in food & beverages, 2015 – 2022, (Kilo Tons) (USD Million)
TABLE 62	Global heat transfer fluid market volume estimates in food & beverages by region, 2012 - 2014 (Kilo Tons)
TABLE 63	Global heat transfer fluid market volume estimates and forecasts in food & beverages by region, 2015 - 2022 (Kilo Tons)
TABLE 64	Global heat transfer fluid revenue estimates in food & beverages by region, 2012 - 2014 (USD Million)
TABLE 65	Global heat transfer fluid revenue estimates and forecasts in food & beverages by region, 2015 - 2022 (USD Million)
TABLE 66	Global heat transfer fluid market estimates in plastics, 2012 – 2014, (Kilo Tons) (USD Million)
TABLE 67	Global heat transfer fluid market estimates and forecast in plastics, 2015 – 2022, (Kilo Tons) (USD Million)
TABLE 68	Global heat transfer fluid market volume estimates in plastics by region, 2012 - 2014 (Kilo Tons)
TABLE 69	Global heat transfer fluid market volume estimates and forecast in plastics by region, 2015 - 2022 (Kilo Tons)
TABLE 70	Global heat transfer fluid revenue estimates in plastics by region, 2012 - 2014 (USD Million)
TABLE 71	Global heat transfer fluid revenue estimates and forecast in plastics by region, 2015 - 2022 (USD Million)
TABLE 72	Global heat transfer fluid market estimates in pharmaceuticals, 2012 – 2014, (Kilo Tons) (USD Million)
TABLE 73	Global heat transfer fluid market estimates and forecast in pharmaceuticals, 2015 – 2022, (Kilo Tons) (USD Million)
TABLE 74	Global heat transfer fluid market volume estimates in pharmaceuticals by region, 2012 - 2014 (Kilo Tons)
TABLE 75	Global heat transfer fluid market volume estimates and forecast in pharmaceuticals by region, 2015 - 2022 (Kilo Tons)
TABLE 76	Global heat transfer fluid revenue estimates in pharmaceuticals by region, 2012 - 2014 (USD Million)
TABLE 77	Global heat transfer fluid revenue estimates and forecast in pharmaceuticals by region, 2015 - 2022 (USD Million)
TABLE 78	Global heat transfer fluid market estimates in HVAC, 2012 – 2014, (Kilo Tons) (USD Million)
TABLE 79	Global heat transfer fluid market estimates and forecast in HVAC, 2015 – 2022, (Kilo Tons) (USD Million)
TABLE 80	Global heat transfer fluid market volume estimates in HVAC by region, 2012 - 2014 (Kilo Tons)
TABLE 81	Global heat transfer fluid market volume estimates and forecast in HVAC by region, 2015 - 2022 (Kilo Tons)
TABLE 82	Global heat transfer fluid revenue estimates in HVAC by region, 2012 - 2014 (USD Million)
TABLE 83	Global heat transfer fluid revenue estimates and forecast in HVAC by region, 2015 - 2022 (USD Million)
TABLE 84	Global heat transfer fluid market estimates in other applications, 2012 – 2014, (Kilo Tons) (USD Million)
TABLE 85	Global heat transfer fluid market estimates and forecast in others, 2015 – 2022, (Kilo Tons)
TABLE 86	Global heat transfer fluid market volume estimates in other applications, 2012 - 2014 (Kilo Tons)
TABLE 87	Global heat transfer fluid market volume estimates and forecast in other applications by region, 2015 - 2022 (kilo tons)
TABLE 88	Global heat transfer fluid revenue estimates in other applications, 2012 - 2014 (USD Million)
TABLE 89	Global heat transfer fluid revenue estimates and forecast in others by region, 2015 - 2022 (USD Million)
TABLE 90	North America heat transfer fluid market estimates, 2012 – 2014, (Kilo Tons) (USD Million)
TABLE 91	North America heat transfer fluid market estimates and forecast, 2015 – 2022, (Kilo Tons) (USD Million)
TABLE 92	North America heat transfer fluid market volume estimates by product, 2012 – 2014, (Kilo Tons)
TABLE 93	North America heat transfer fluid market volume estimates and forecast by product, 2015 - 2022 (Kilo Tons)
TABLE 94	North America heat transfer fluid revenue estimates by product, 2012 – 2014, (USD Million)
TABLE 95	North America heat transfer fluid revenue estimates and forecast by product, 2015 - 2022 (USD Million)
TABLE 96	North America heat transfer fluid market volume estimates by application, 2012 – 2014, (Kilo Tons)
TABLE 97	North America heat transfer fluid market volume estimates and forecast by application, 2015 - 2022 (Kilo Tons)
TABLE 98	North America heat transfer fluid revenue estimates by application, 2012 – 2014, (USD Million)
TABLE 99	North America heat transfer fluid revenue estimates and forecast by application, 2015 - 2022 (USD Million)
TABLE 100	U.S. heat transfer fluid market estimates, 2012 – 2014, (Kilo Tons) (USD Million)
TABLE 101	U.S. heat transfer fluid market estimates and forecast, 2015 – 2022, (Kilo Tons) (USD Million)
TABLE 102	U.S. heat transfer fluid market volume estimates by product, 2012 – 2014, (Kilo Tons)
TABLE 103	U.S. heat transfer fluid market volume estimates and forecast by product, 2015 - 2022 (Kilo Tons)
TABLE 104	U.S. heat transfer fluid revenue estimates by product, 2012 – 2014, (USD Million)
TABLE 105	U.S. heat transfer fluid revenue estimates and forecast by product, 2015 - 2022 (USD Million)
TABLE 106	U.S. heat transfer fluid market volume estimates by application, 2012 – 2014, (Kilo Tons)
TABLE 107	U.S. heat transfer fluid market volume estimates and forecast by application, 2015 - 2022 (Kilo Tons)
TABLE 108	U.S. heat transfer fluid revenue estimates by application, 2012 – 2014, (USD Million)
TABLE 109	U.S. heat transfer fluid revenue estimates and forecast by application, 2015 - 2022 (USD Million)
TABLE 110	Canada heat transfer fluid market estimates, 2012 – 2014, (Kilo Tons) (USD Million)
TABLE 111	Canada heat transfer fluid market estimates and forecast, 2015 – 2022, (Kilo Tons) (USD Million)
TABLE 112	Canada heat transfer fluid market volume estimates by product, 2012 – 2014, (Kilo Tons)
TABLE 113	Canada heat transfer fluid market volume estimates and forecast by product, 2015 - 2022 (Kilo Tons)
TABLE 114	Canada heat transfer fluid revenue estimates by product, 2012 – 2014, (USD Million)
TABLE 115	Canada heat transfer fluid revenue estimates and forecast by product, 2015 - 2022 (USD Million)
TABLE 116	Canada heat transfer fluid market volume estimates by application, 2012 – 2014, (Kilo Tons)
TABLE 117	Canada heat transfer fluid market volume estimates and forecast by application, 2015 - 2022 (Kilo Tons)
TABLE 118	Canada heat transfer fluid revenue estimates by application, 2012 – 2014, (USD Million)
TABLE 119	Canada heat transfer fluid revenue estimates and forecast by application, 2015 - 2022 (USD Million)
TABLE 120	Europe heat transfer fluid market estimates, 2012 – 2014, (Kilo Tons) (USD Million)
TABLE 121	Europe heat transfer fluid market estimates and forecast, 2015 – 2022, (Kilo Tons) (USD Million)
TABLE 122	Europe heat transfer fluid market volume estimates by product, 2012 – 2014, (Kilo Tons)
TABLE 123	Europe heat transfer fluid market volume estimates and forecast by product, 2015 - 2022 (Kilo Tons)
TABLE 124	Europe heat transfer fluid revenue estimates by product, 2012 – 2014, (USD Million)
TABLE 125	Europe heat transfer fluid revenue estimates and forecast by product, 2015 - 2022 (USD Million)
TABLE 126	Europe heat transfer fluid market volume estimates by application, 2012 – 2014, (Kilo Tons)
TABLE 127	Europe heat transfer fluid market volume estimates and forecast by application, 2015 - 2022 (Kilo Tons)
TABLE 128	Europe heat transfer fluid revenue estimates by application, 2012 – 2014, (USD Million)
TABLE 129	Europe heat transfer fluid revenue estimates and forecast by application, 2015 - 2022 (USD Million)
TABLE 130	Germany heat transfer fluid market estimates, 2012 – 2014, (Kilo Tons) (USD Million)
TABLE 131	Germany heat transfer fluid market estimates and forecast, 2015 – 2022, (Kilo Tons) (USD Million)
TABLE 132	Germany heat transfer fluid market volume estimates by product, 2012 – 2014, (Kilo Tons)
TABLE 133	Germany heat transfer fluid market volume estimates and forecast by product, 2015 - 2022 (Kilo Tons)
TABLE 134	Germany heat transfer fluid revenue estimates by product, 2012 – 2014, (USD Million)
TABLE 135	Germany heat transfer fluid revenue estimates and forecast by product, 2015 - 2022 (USD Million)
TABLE 136	Germany heat transfer fluid market volume estimates by application, 2012 – 2014, (Kilo Tons)
TABLE 137	Germany heat transfer fluid market volume estimates and forecast by application, 2015 - 2022 (Kilo Tons)
TABLE 138	Germany heat transfer fluid revenue estimates by application, 2012 – 2014, (USD Million)
TABLE 139	Germany heat transfer fluid revenue estimates and forecast by application, 2015 - 2022 (USD Million)
TABLE 140	UK heat transfer fluid market estimates, 2012 – 2014, (Kilo Tons) (USD Million)
TABLE 141	UK heat transfer fluid market estimates and forecast, 2015 – 2022, (Kilo Tons) (USD Million)
TABLE 142	UK heat transfer fluid market volume estimates by product, 2012 – 2014, (Kilo Tons)
TABLE 143	UK heat transfer fluid market volume estimates and forecast by product, 2015 - 2022 (Kilo Tons)
TABLE 144	UK heat transfer fluid revenue estimates by product, 2012 – 2014, (USD Million)
TABLE 145	UK heat transfer fluid revenue estimates and forecast by product, 2015 - 2022 (USD Million)
TABLE 146	UK heat transfer fluid market volume estimates by application, 2012 – 2014, (Kilo Tons)
TABLE 147	UK heat transfer fluid market volume estimates and forecast by application, 2015 - 2022 (Kilo Tons)
TABLE 148	UK heat transfer fluid revenue estimates by application, 2012 – 2014, (USD Million)
TABLE 149	UK heat transfer fluid revenue estimates and forecast by application, 2015 - 2022 (USD Million)
TABLE 150	Asia Pacific heat transfer fluid market estimates, 2012 – 2014, (Kilo Tons) (USD Million)
TABLE 151	Asia Pacific heat transfer fluid market estimates and forecast, 2015 – 2022, (Kilo Tons) (USD Million)
TABLE 152	Asia Pacific heat transfer fluid market volume estimates by product, 2012 – 2014, (Kilo Tons)
TABLE 153	Asia Pacific heat transfer fluid market volume estimates and forecast by product, 2015 - 2022 (Kilo Tons)
TABLE 154	Asia Pacific heat transfer fluid revenue estimates by product, 2012 – 2014, (USD Million)
TABLE 155	Asia Pacific heat transfer fluid revenue estimates and forecast by product, 2015 - 2022 (USD Million)
TABLE 156	Asia Pacific heat transfer fluid market volume estimates by application, 2012 – 2014, (Kilo Tons)
TABLE 157	Asia Pacific heat transfer fluid market volume estimates and forecast by application, 2015 - 2022 (Kilo Tons)
TABLE 158	Asia Pacific heat transfer fluid revenue estimates by application, 2012 – 2014, (USD Million)
TABLE 159	Asia Pacific heat transfer fluid revenue estimates and forecast by application, 2015 - 2022 (USD Million)
TABLE 160	China heat transfer fluid market estimates, 2012 – 2014, (Kilo Tons) (USD Million)
TABLE 161	China heat transfer fluid market estimates and forecast, 2015 – 2022, (Kilo Tons) (USD Million)
TABLE 162	China heat transfer fluid market volume estimates by product, 2012 – 2014, (Kilo Tons)
TABLE 163	China heat transfer fluid market volume estimates and forecast by product, 2015 - 2022 (Kilo Tons)
TABLE 164	China heat transfer fluid revenue estimates by product, 2012 – 2014, (USD Million)
TABLE 165	China heat transfer fluid revenue estimates and forecast by product, 2015 - 2022 (USD Million)
TABLE 166	China heat transfer fluid market volume estimates by application, 2012 – 2014, (Kilo Tons)
TABLE 167	China heat transfer fluid market volume estimates and forecast by application, 2015 - 2022 (Kilo Tons)
TABLE 168	China heat transfer fluid revenue estimates by application, 2012 – 2014, (USD Million)
TABLE 169	China heat transfer fluid revenue estimates and forecast by application, 2015 - 2022 (USD Million)
TABLE 170	India heat transfer fluid market estimates, 2012 – 2014, (Kilo Tons) (USD Million)
TABLE 171	India heat transfer fluid market estimates and forecast, 2015 – 2022, (Kilo Tons) (USD Million)
TABLE 172	India heat transfer fluid market volume estimates by product, 2012 – 2014, (Kilo Tons)
TABLE 173	India heat transfer fluid market volume estimates and forecast by product, 2015 - 2022 (Kilo Tons)
TABLE 174	India heat transfer fluid revenue estimates by product, 2012 – 2014, (USD Million)
TABLE 175	India heat transfer fluid revenue estimates and forecast by product, 2015 - 2022 (USD Million)
TABLE 176	India heat transfer fluid market volume estimates by application, 2012 – 2014, (Kilo Tons)
TABLE 177	India heat transfer fluid market volume estimates and forecast by application, 2015 - 2022 (Kilo Tons)
TABLE 178	India heat transfer fluid revenue estimates by application, 2012 – 2014, (USD Million)
TABLE 179	India heat transfer fluid revenue estimates and forecast by application, 2015 - 2022 (USD Million)
TABLE 180	Japan heat transfer fluid market estimates, 2012 – 2014, (Kilo Tons) (USD Million)
TABLE 181	Japan heat transfer fluid market estimates and forecast, 2015 – 2022, (Kilo Tons) (USD Million)
TABLE 182	Japan heat transfer fluid market volume estimates by product, 2012 – 2014, (Kilo Tons)
TABLE 183	Japan heat transfer fluid market volume estimates and forecast by product, 2015 - 2022 (Kilo Tons)
TABLE 184	Japan heat transfer fluid revenue estimates by product, 2012 – 2014, (USD Million)
TABLE 185	Japan heat transfer fluid revenue estimates and forecast by product, 2015 - 2022 (USD Million)
TABLE 186	Japan heat transfer fluid market volume estimates by application, 2012 – 2014, (Kilo Tons)
TABLE 187	Japan heat transfer fluid market volume estimates and forecast by application, 2015 - 2022 (Kilo Tons)
TABLE 188	Japan heat transfer fluid revenue estimates by application, 2012 – 2014, (USD Million)
TABLE 189	Japan heat transfer fluid revenue estimates and forecast by application, 2015 - 2022 (USD Million)
TABLE 190	Middle East & Africa heat transfer fluid market estimates, 2012 – 2014, (Kilo Tons) (USD Million)
TABLE 191	Middle East & Africa heat transfer fluid market estimates and forecast, 2015 – 2022, (Kilo Tons) (USD Million)
TABLE 192	Middle East & Africa heat transfer fluid market volume estimates by product, 2012 – 2014, (Kilo Tons)
TABLE 193	Middle East & Africa heat transfer fluid market volume estimates and forecast by product, 2015 - 2022 (Kilo Tons)
TABLE 194	Middle East & Africa heat transfer fluid revenue estimates by product, 2012 – 2014, (USD Million)
TABLE 195	Middle East & Africa heat transfer fluid revenue estimates and forecast by product, 2015 - 2022 (USD Million)
TABLE 196	Middle East & Africa heat transfer fluid market volume estimates by application, 2012 – 2014, (Kilo Tons)
TABLE 197	Middle East & Africa heat transfer fluid market volume estimates and forecast by application, 2015 - 2022 (Kilo Tons)
TABLE 198	Middle East & Africa heat transfer fluid revenue estimates by application, 2012 – 2014, (USD Million)
TABLE 199	Middle East & Africa heat transfer fluid revenue estimates and forecast by application, 2015 - 2022 (USD Million)
TABLE 200	Central & South America heat transfer fluid market estimates, 2012 – 2014, (Kilo Tons) (USD Million)
TABLE 201	Central & South America heat transfer fluid market estimates and forecast, 2015 – 2022, (Kilo Tons) (USD Million)
TABLE 202	Central & South America heat transfer fluid market volume estimates by product, 2012 – 2014, (Kilo Tons)
TABLE 203	Central & South America heat transfer fluid market volume estimates and forecast by product, 2015 - 2022 (Kilo Tons)
TABLE 204	Central & South America heat transfer fluid revenue estimates by product, 2012 – 2014, (USD Million)
TABLE 205	Central & South America heat transfer fluid revenue estimates and forecast by product, 2015 - 2022 (USD Million)
TABLE 206	Central & South America heat transfer fluid market volume estimates by application, 2012 – 2014, (Kilo Tons)
TABLE 207	Central & South America heat transfer fluid market volume estimates and forecast by application, 2015 - 2022 (Kilo Tons)
TABLE 208	Central & South America heat transfer fluid revenue estimates by application, 2012 – 2014, (USD Million)
TABLE 209	Central & South America heat transfer fluid revenue estimates and forecast by application, 2015 - 2022 (USD Million)

Speak to the report author to design an exclusive study to serve your research needs.
Your personal and confidential information is safe and secure.

