Toll Free: 1-888-928-9744
Toll Free: 1-888-928-9744

Published: Oct, 2015 | Pages:
74 | Publisher: Radiant Insights Inc.
Industry: Semiconductors | Report Format: Electronic (PDF)
FPGA Market Size By Application (Automotive, Consumer Electronics, Data Processing, Industrial, Military And Aerospace, Telecom) Competitive Analysis & Forecast, 2012 - 2020 Industry Overview Global Field-Programmable Gate Array (FPGA) market size is likely to attain USD 9.88 billion by 2020, growing at a CAGR of 9.1% from 2014 to 2020. Escalating demand for customized IC’s is expected to drive demand growth over the next six years. Customized IC’s facilitates designers to change their designs even after the end product has been deployed in the field. In addition, high degree of flexibility is also driven by field upgrades from a remote location, thus eliminating re-design costs. Global increase in demand from application areas such as industrial, automotive and healthcare is expected to fuel FPGA market growth over the forecast period. They are primarily deployed, in order to enhance image quality in smartphones. They are also used for various purposes in flat panel displays including video processing, panel driver or controller, display panel application, video board application, and operating mode and battery management. In addition, it is widely used in automotive industry. This is mainly on account of the high degree of electronic content in automobiles. This is for purposes such as driver assistance, rear-view camera, forward camera, surround-view camera, infotainment, and electric vehicles. Moreover, technology innovation is also expected to boost global demand. The wide adoption of 3G and LTE technologies in the wireless telecom segment has increased the demand for wider bandwidth in wireless networks. For instance, Altera Corp. developed FPGA which integrates a 11.3 Gbps transceiver to meet the high-speed bandwidth. Design complexity and threat of ASIC as substitute are posing a challenge to industry growth. Increasing demand in application areas has led to complexities regarding designs. However, major companies are working on this issue. For instance, Altera Europe expanded its systems solution engineering group in order to prevent challenges faced in implementation. The company has focused on making it easier to develop complete systems on FPGAs by turning their platforms into solutions. North America FPGA market, by Application, 2012-2020 (USD Million)Application Overview Telecom is the highest revenue generator as well as the fastest growing application segment in FPGA market. Telecom sector were valued over USD 1,700.0 million in 2013, growing at a CAGR of over 9% from 2014 to 2020. With the introduction of telecom specific design services and IP (intellectual property) cores, it offers various benefits such as flexibility and reduced time which in turn boost the demand for this industry. Industrial applications valued over USD 1,100.0 million in 2013, growing at a CAGR of 8% from 2014 to 2020. Key benefits include flexibility to change designs in regards to changing requirements, increased design integration, scalable performance and low cost. Further various smart grid applications incorporate FPGA technology for better reliability and cost effectiveness. In 2013, the revenue share of automotive and consumer electronics segment was over 17% and 12% respectively. Regional Overview Asia Pacific FPGA market dominated demand with valuation of over USD 2,100.0 million in 2013. This region is also expected to be the fastest growing region, growing at a CAGR of 9.6% from 2014 to 2020. This is primarily due to increasing applications usage in various telecom and consumer electronics segment. North America was the second largest regional FPGA industry and accounted for over 28% of the total demand in 2013. This is primarily due to huge investment in research and development department for military and aerospace applications. In addition, developments in the telecommunication sector are expected to drive the regional industry over the forecast period from 2014 to 2020. Competitive Market Share The global FPGA market share is highly consolidated, with the top three companies accounting for more than 90% of the total demand in 2013. Xilinx Inc. emerged as the leading company and accounted for over 47% of the total FPGA market share in 2013. Altera Corporation and Lattice Semiconductor together accounted for over 45% of total demand in 2013 respectively. Other key companies include Microsemi Corporation, Tabula, Achronix, Cypress Semiconductors and QuickLogic Corporation.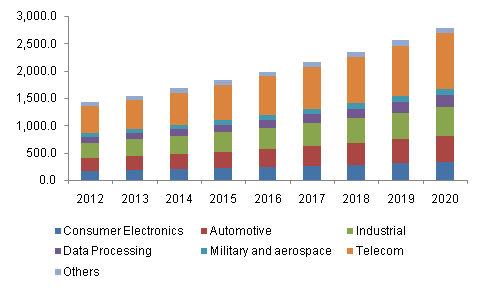
 Table of Contents

Chapter 1 Executive Summary
1.1 FPGA - Industry Summary & Critical Success Factors (CSFs)

Chapter 2 FPGA Industry Overview
	2.1 Market Segmentation
	2.2 Market Size and Growth Prospects
	2.3 FPGA Value Chain Analysis
2.3.1 Key Driver Analysis
	2.3.1.1 Increased demand for customizable ICs
	2.3.1.2 Growing demand from application areas
	2.3.1.3 Technological advancement
2.3.2 Key Restraint Analysis
 	2.3.2.1 Design complexity
	2.3.2.2 Threat of ASIC as substitute
	2.4 FPGA Market Dynamics
	2.5 Key Opportunities Prioritized
	2.6 Industry Analysis - Porter's
	2.7 FPGA Company Market Share Analysis, 2013
	2.8 FPGA PESTEL Analysis

Chapter 3 FPGA Application Overview
	3.1 Automotive
3.1.1 Global FPGA demand in automotive, by region, (USD Million), 2012 - 2020
	3.2 Consumer Electronics
3.2.1 Global FPGA demand in consumer electronics, by region, (USD Million), 2012 – 2020
	3.3 Data Processing
3.3.1 Global FPGA demand in data processing, by region, (USD Million), 2012 - 2020
	3.4 Industrial
3.4.1 Global FPGA demand in industrial applications, by region, (USD Million), 2012 – 2020
	3.5 Military and Aerospace
3.5.1 Global FPGA demand in military and aerospace, by region, (USD Million), 2012 - 2020
	3.6 Telecommunication
3.6.1 Global FPGA demand in telecommunication, by region, (USD Million), 2012 - 2020
	3.7 Others
3.7.1 Global FPGA demand in other applications, by region, (USD Million), 2012 - 2020

Chapter 4 FPGA Regional Overview
	4.1 North America
4.1.1 North America FPGA market revenue by application, (USD Million), 2012 - 2020
	4.2 Europe
4.2.1 Europe FPGA market revenue by application, (USD Million), 2012 – 2020
	4.3 Asia Pacific
4.3.1 Asia Pacific FPGA market revenue by application, (USD Million), 2012 – 2020
	4.4 RoW
4.4.1 RoW FPGA market revenue by application, (USD Million), 2012 – 2020

Chapter 5 Competitive Landscape
	5.1 Revenue Analysis
	5.2 Product Benchmarking
	5.3 Strategic Development

Chapter 6 Methodology and Scope
	6.1 Research Methodology
	6.2 Research Scope & Assumption
	6.3 List of Data Sources

Companies analyzed in Chapter 5
1.	Aeroflex Inc
2.	Altera Corporation
3.	Anadigm
4.	ARM Holdings
5.	Atmel Corporation
6.	Freescale Semiconductor
7.	Infineon Technologies
8.	Intel Corporation
9.	Lattice Semiconductor
10.	MicroSemi
11.	Microchip Technology
12.	Microsoft Corporation
13.	NXP Semiconductors
14.	Quicklogic Corp
15.	Renesas Electronics Corporation
16.	Samsung Electronics Corporation
17.	Semiconductor Cypress
18.	SiliconBlue Technologies
19.	STMicroelectronics
20.	Texas Instruments
21.	Vantis
22.	Xilinx
List of Tables

1.	FPGA – Industry Summary & Critical Success Factors (CSFs)
2.	Global FPGA market (USD Million), 2012 - 2020
3.	Global FPGA market by region (USD Million), 2012 – 2020
4.	Global FPGA market by application (USD Million), 2012 – 2020
5.	Global FPGA demand in automotive (USD Million), 2012 – 2020
6.	Global FPGA demand in automotive, by region, (USD Million), 2012 – 2020
7.	Global FPGA demand in consumer electronics (USD Million), 2012 – 2020
8.	Global FPGA demand in consumer electronics, by region, (USD Million), 2012 – 2020
9.	Global FPGA demand in data processing (USD Million), 2012 – 2020
10.	Global FPGA demand in data processing, by region, (USD Million), 2012 – 2020
11.	Global FPGA demand in industrial applications (USD Million), 2012 – 2020
12.	Global FPGA demand in industrial applications, by region, (USD Million), 2012 – 2020
13.	Global FPGA demand in military and aerospace (USD Million), 2012 – 2020
14.	Global FPGA demand in military and aerospace, by region, (USD Million), 2012 – 2020
15.	Global FPGA demand in telecommunication (USD Million), 2012 – 2020
16.	Global FPGA demand in telecommunication, by region, (USD Million), 2012 – 2020
17.	Global FPGA demand in other applications (USD Million), 2012 – 2020
18.	Global FPGA demand in other applications, by region, (USD Million), 2012 – 2020
19.	North America FPGA market by application (USD Million), 2012 – 2020
20.	Europe FPGA market by application (USD Million), 2012 – 2020
21.	Asia Pacific FPGA market by application (USD Million), 2012 – 2020
22.	RoW FPGA market by application (USD Million), 2012 – 2020

List of Figures

1.	FPGA Market Segmentation
2.	Global FPGA market (USD Million), 2012 - 2020
3.	FPGA value chain analysis
4.	FPGA market dynamics
5.	FPGA - Company market share analysis, 2013
6.	Key Opportunities Prioritized
7.	Industry Analysis - Porter's
8.	FPGA PESTEL Analysis, 2013
9.	FPGA market share by application, 2013 & 2020
10.	Global FPGA demand in automotive (USD Million), 2012 – 2020
11.	Global FPGA demand in consumer electronics (USD Million), 2012 – 2020
12.	Global FPGA demand in data processing (USD Million), 2012 – 2020
13.	Global FPGA demand in industrial applications (USD Million), 2012 – 2020
14.	Global FPGA demand in military and aerospace (USD Million), 2012 – 2020
15.	Global FPGA demand in telecommunication (USD Million), 2012 – 2020
16.	Global FPGA demand in other applications (USD Million), 2012 – 2020
17.	FPGA market share by region, 2013 & 2020
18.	North America FPGA market, by application (USD Million), 2012 – 2020
19.	Europe FPGA market, by application (USD Million), 2012 – 2020
20.	Asia Pacific FPGA market, by application (USD Million), 2012 – 2020
21.	RoW FPGA market, by application (USD Million), 2012 – 2020

Speak to the report author to design an exclusive study to serve your research needs.
Your personal and confidential information is safe and secure.

