Toll Free: 1-888-928-9744
Toll Free: 1-888-928-9744

Published: Oct, 2015 | Pages:
205 | Publisher: Radiant Insights Inc.
Industry: HVAC | Report Format: Electronic (PDF)
The Report Contains Europe Industrial Air Filtration Market Size By Application (Cement, Metals, Power, Food, Pharmaceuticals), By Product (Dust Collectors, HEPA Filters, Mist Collectors, CC&F, Baghouse Filters), Competitive Analysis & Forecasts To 2020 Industry Overview Europe industrial air filtration market size is forecast to reach USD 1.69 billion by 2020, growing at a CAGR of over 7% from 2014 to 2020. The industry is expected to be primarily driven by the enforcement of occupational health and safety regulations. Stringent government norms are likely to spur the industry growth over the forecast period. IPPC (Integrated Pollution Prevention and Control) with sectoral directive has setup the emission limit standards for large combustion plants to reduce air pollution. The dust collectors market was valued at USD 219.7 million in 2013, and is expected to reach USD 365.9 million by 2020 growing at an estimated CAGR of 7.7% from 2014 to 2020. Several manufacturing activities are focused on lean manufacturing and eliminating waste within the manufacturing processes. The industrial air filtration industry is anticipated to experience gains, owing to formulation of EN 779:2011, European standard for specific air filters. The standard is likely to eradicate filter performance issues. For instance, electrostatic charged synthetic filters tend to discharge rapidly within few weeks of its operations, and their ability to filter deteriorates substantially over time. In addition, an efficient system helps in augmenting safety as well as health aspects and thus aids in ensuring supply reliability. It also facilitates in energy optimization by reducing energy consumption and minimizing the risk of loss of production. Revenue from the power sector was valued at USD 188.8 million in 2013, and is expected to reach USD 317.9 million by 2020, growing at an estimated CAGR of 7.9% from 2014 to 2020. The market is expected to witness considerable growth as air filtration systems help handle toxic, hazardous, and radioactive gas streams. High cost involved in installation is projected to hamper the industry growth over the forecast period. In addition, high maintenance cost and energy consumption rate is expected to challenge the Europe industrial air filtration market. HEPA filters are estimated to witness significant growth owing to commercial benefits offered namely augmented plant revenue, better yield, low labor as well as component cost. These are also used in applications concerning biological, chemical and radioactive material. Furthermore, mist collectors are projected to provide potential opportunities owing to its unique property of filtering dust and wet emission from food & bevrage and metals industry.Germany industrial air filtration market size, by product, 2012-2020 (USD million)Product Overview HEPA filters were valued over USD 240 million in 2013. It is estimated to witness highest growth owing to is large scale usages in several applications requiring high collection efficiency of submicron particulate matter. It is likely to grow at a CAGR of over 8% from 2014 to 2020. Baghouse Filters accounted for more than 22% of the overall market share in 2013 and is expected to grow at a CARG of over 7.5% from 2014 to 2020. The growth can be attributed to its capacity to handle large air volume as well as heavy dust loading capacity involved in cement & food processing industries. Application Overview Metals sector was accounted for over 20% of the overall Europe industrial air filtration market share in 2013. It is anticipated to exceed USD 370 million by 2020, growing at CAGR of over 7.5% from 2014 to 2020. Surge in the sector can be addressed to air-borne suspensions removal capability of the filter. Food sector was valued over USD 220 million 2013. It is projected to witness highest growth rate of around 8% from 2014 to 2020 due to sanitary, cross contamination and food handling regulations in the industry. Regional Overview Italy industrial air filtration market was valued over USD 170 million in 2013 and it is estimated to grow at over 7% from 2014 to 2020. It is likely to exhibit considerable growth owing to growing pharmaceutical industries in the region. Germany occupied the highest industry share in 2013. It is expected to grow at a CAGR of 8.5% from 2014 to 2020. Spur in the region can be addressed to flourishing use of dust collectors in metal processing industry along with increasing HEPA filter use in food and beverage industry. Competitive Market Share Europe industrial air filtration market share is highly consolidated by top three industry participants accounting for more than 50% of the overall industry share in 2013. Donaldson Company Inc is anticipated to hold key position owing to high R&D spend, sales, new product development and marketing activities. Key industry players include Clarcor Inc and Camfil among others.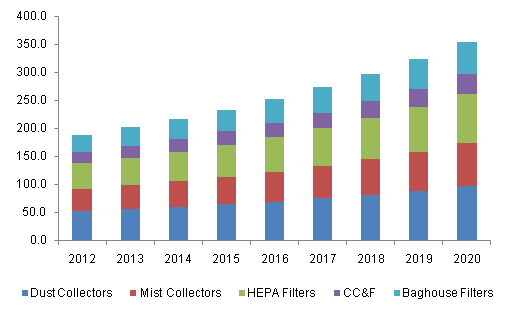
 Table of Contents

Chapter 1	Executive Summary

Chapter 2	Industrial Air Filtration Industry Overview
2.1	Market segmentation
2.2	Market Size and Growth Prospects
2.3	Industrial Air Filtration - Value Chain Analysis
2.4	Industrial Air Filtration – Market dynamics
2.4.1	Market driver analysis
2.4.1.1	Stringent government regulations (Regulations affecting key industries)
2.4.1.2	Need to achieve energy efficiency
2.4.2	Market restraint analysis
2.4.2.1	Cost concerns
2.5	Key opportunities - Prioritized
2.6	Europe industrial air filtration - Company market share analysis, 2013
2.7	Industry Analysis – Porter’s
2.8	Industrial air filtration – PESTEL Analysis
2.9	Key trends
2.9.1	Manufacturing moving to Eastern Europe
2.9.2	First-fit equipment vs. aftermarket filters
2.9.3	Focus on industrial uses and applications

Chapter 3	Industrial Air Filtration Product Overview
3.1	Industrial air filtration market share by product, 2013 & 2020
3.2	Dust Collectors
3.3	Mist Collectors
3.4	HEPA Filters
3.5	CC&F
3.6	Baghouse Filters

Chapter 4	Industrial Air Filtration Application Overview
4.1	Industrial air filtration market share by application, 2013 & 2020
4.2	Cement
4.3	Food
4.4	Metals
4.5	Power
4.6	Pharmaceuticals
4.7	Others

Chapter 5	Industrial Air Filtration Regional Overview
5.1	Europe industrial air filtration by region, 2013 & 2020
5.2	Germany
5.2.1	Germany market by product, 2012 – 2020
5.2.2	Germany market by application, 2012 – 2020
5.3	UK
5.3.1	UK market by product, 2012 – 2020
5.3.2	UK market by application, 2012 – 2020
5.4	France
5.4.1	France market by product, 2012 – 2020
5.4.2	France market by application, 2012 – 2020
5.5	Italy
5.5.1	Italy market by product, 2012 – 2020
5.5.2	Italy market by application, 2012 – 2020
5.6	Turkey
5.6.1	Turkey market by product, 2012 – 2020
5.6.2	Turkey market by application, 2012 – 2020
5.7	Sweden
5.7.1	Sweden market by product, 2012 – 2020
5.7.2	Sweden market by application, 2012 – 2020
5.8	Spain
5.8.1	Spain market by product, 2012 – 2020
5.8.2	Spain market by application, 2012 – 2020
5.9	Poland
5.9.1	Poland market by product, 2012 – 2020
5.9.2	Poland market by application, 2012 – 2020
5.10	Rest of Europe
5.10.1	Rest of Europe market by product, 2012 – 2020
5.10.2	Rest of Europe market by application, 2012 – 2020

Chapter 6	Competitive Landscape
6.1	AAF International
6.1.1	Company Overview
6.1.2	Financial Performance
6.1.3	Product Benchmarking
6.1.4	Strategic Initiatives
6.2	Absolent Group (& Bristol)
6.2.1	Company Overview
6.2.2	Financial Performance
6.2.3	Product Benchmarking
6.2.4	Strategic Initiatives
6.3	Andrew Industries Limited
6.3.1	Company Overview
6.3.2	Financial Performance
6.3.3	Product Benchmarking
6.3.4	Strategic Initiatives
6.4	BWF Group
6.4.1	Company Overview
6.4.2	Financial Performance
6.4.3	Product Benchmarking
6.4.4	Strategic Initiatives
6.5	Camfil Group
6.5.1	Company Overview
6.5.2	Financial Performance
6.5.3	Product Benchmarking
6.5.4	Strategic Initiatives
6.6	Clarcor Inc
6.6.1	Company Overview
6.6.2	Financial Performance
6.6.3	Product Benchmarking
6.6.4	Strategic Initiatives
6.7	Cummins Filtration Inc.
6.7.1	Company Overview
6.7.2	Financial Performance
6.7.3	Product Benchmarking
6.7.4	Strategic Initiatives
6.8	Donaldson Company Inc.
6.8.1	Company Overview
6.8.2	Financial Performance
6.8.3	Product Benchmarking
6.8.4	Strategic Initiatives
6.9	Flanders Corporation
6.9.1	Company Overview
6.9.2	Financial Performance
6.9.3	Product Benchmarking
6.9.4	Strategic Initiatives
6.10	Flow Air Filters
6.10.1	Company Overview
6.10.2	Financial Performance
6.10.3	Product Benchmarking
6.11	Freudenberg Filtration Technologies
6.11.1	Company Overview
6.11.2	Financial Performance
6.11.3	Product Benchmarking
6.11.4	Strategic Initiatives
6.12	GUTSCHE
6.12.1	Company Overview
6.12.2	Financial Performance
6.12.3	Product Benchmarking
6.13	iFIL
6.13.1	Company Overview
6.13.2	Financial Performance
6.13.3	Product Benchmarking
6.14	KAYSER FILTERTECH GmbH
6.14.1	Company Overview
6.14.2	Financial Performance
6.14.3	Product Benchmarking
6.15	Keller Lufttechnik
6.15.1	Company Overview
6.15.2	Financial Performance
6.15.3	Product Benchmarking
6.16	KEMPER
6.16.1	Company Overview
6.16.2	Financial Performance
6.16.3	Product Benchmarking
6.16.4	Strategic Initiatives
6.17	LOSMA
6.17.1	Company Overview
6.17.2	Financial Performance
6.17.3	Product Benchmarking
6.17.4	Strategic Initiatives
6.18	Mahle
6.18.1	Company Overview
6.18.2	Financial Performance
6.18.3	Product Benchmarking
6.18.4	Strategic Initiatives
6.19	MANN+HUMMEL
6.19.1	Company Overview
6.19.2	Financial Performance
6.19.3	Product Benchmarking
6.19.4	Strategic Initiatives
6.20	Mortelecque
6.20.1	Company Overview
6.20.2	Financial Performance
6.20.3	Product Benchmarking
6.21	Nederman
6.21.1	Company Overview
6.21.2	Financial Performance
6.21.3	Product Benchmarking
6.21.4	Strategic Initiatives
6.22	Nordic Air Filtration
6.22.1	Company Overview
6.22.2	Financial Performance
6.22.3	Product Benchmarking
6.22.4	Strategic Initiatives
6.23	Plymovent
6.23.1	Company Overview
6.23.2	Financial Performance
6.23.3	Product Benchmarking
6.23.4	Strategic Initiatives
6.24	Pall Corporation
6.24.1	Company Overview
6.24.2	Financial Performance
6.24.3	Product Benchmarking
6.24.4	Strategic Initiatives
6.25	Purafil
6.25.1	Company Overview
6.25.2	Financial Performance
6.25.3	Product Benchmarking
6.25.4	Strategic Initiatives
6.26	SPX Corporation
6.26.1	Company Overview
6.26.2	Financial Performance
6.26.3	Product Benchmarking
6.26.4	Strategic Initiatives
6.27	Testori
6.27.1	Company Overview
6.27.2	Financial Performance
6.27.3	Product Benchmarking
6.27.4	Strategic Initiatives
6.28	TEKA
6.28.1	Company Overview
6.28.2	Financial Performance
6.28.3	Product Benchmarking
6.29	TTL
6.29.1	Company Overview
6.29.2	Financial Performance
6.29.3	Product Benchmarking
6.30	Vokes Air
6.30.1	Company Overview
6.30.2	Financial Performance
6.30.3	Product Benchmarking
6.30.4	Strategic Initiatives
6.31	W.L. Gore & Associates
6.31.1	Company Overview
6.31.2	Financial Performance
6.31.3	Product Benchmarking
6.31.4	Strategic Initiatives

Chapter 7	Methodology and Scope
7.1	Research Methodology
7.2	Research Scope & Assumptions
7.3	List of Data Sources
List of Tables

TABLE 1	Europe Industrial Air Filtration – Industry Summary & Critical Success Factors (CSFs)
TABLE 2	Europe industrial air filtration market (USD Million), 2012 - 2020
TABLE 3	Europe industrial air filtration market by region, (USD Million), 2012 - 2020
TABLE 4	Europe industrial air filtration market by product, (USD Million), 2012 – 2020
TABLE 5	Europe industrial air filtration market by application, (USD Million), 2012 – 2020
TABLE 6	Industrial air filtration – Key market driver impact
TABLE 7	Industrial air filtration – Key market restraint impact
TABLE 8	Europe dust collectors demand (USD Million), 2012 - 2020
TABLE 9	Europe dust collectors demand, by region (USD Million), 2012 – 2020
TABLE 10	Europe mist collector demand (USD Million), 2012 - 2020
TABLE 11	Europe mist collector demand by region (USD Million), 2012 – 2020
TABLE 12	Europe HEPA filters demand (USD Million), 2012 - 2020
TABLE 13	Europe HEPA filters demand by region (USD Million), 2012 – 2020
TABLE 14	Europe CC&F demand (USD Million), 2012 – 2020
TABLE 15	Europe CC&F demand by region (USD Million), 2012 – 2020
TABLE 16	Europe baghouse filters demand (USD Million), 2012 – 2020
TABLE 17	Europe baghouse filters demand by region (USD Million), 2012 – 2020
TABLE 18	Europe industrial air filtration demand in cement (USD Million), 2012 – 2020
TABLE 19	Europe industrial air filtration demand in cement by region (USD Million), 2012 – 2020
TABLE 20	Europe industrial air filtration demand in food (USD Million), 2012 – 2020
TABLE 21	Europe industrial air filtration demand in food by region (USD Million), 2012 – 2020
TABLE 22	Europe industrial air filtration demand in metal (USD Million), 2012 – 2020
TABLE 23	Europe industrial air filtration demand in metal by region (USD Million), 2012 – 2020
TABLE 24	Europe industrial air filtration demand in power (USD Million), 2012 – 2020
TABLE 25	Europe industrial air filtration demand in power by region (USD Million), 2012 – 2020
TABLE 26	Europe industrial air filtration demand in pharmaceuticals (USD Million), 2012 – 2020
TABLE 27	Europe industrial air filtration demand in pharmaceuticals by region (USD Million), 2012 – 2020
TABLE 28	Europe industrial air filtration demand in other applications (USD Million), 2012 – 2020
TABLE 29	Europe industrial air filtration demand in other applications by region (USD Million), 2012 – 2020
TABLE 30	Germany market by product (USD Million), 2012 – 2020
TABLE 31	Germany market by application (USD Million), 2012 – 2020
TABLE 32	UK market by product (USD Million), 2012 – 2020
TABLE 33	UK market by application (USD Million), 2012 – 2020
TABLE 34	France market by product (USD Million), 2012 – 2020
TABLE 35	France market by application (USD Million), 2012 – 2020
TABLE 36	Italy market by product (USD Million), 2012 – 2020
TABLE 37	Italy market by application (USD Million), 2012 – 2020
TABLE 38	Turkey market by product (USD Million), 2012 – 2020
TABLE 39	Turkey market by application (USD Million), 2012 – 2020
TABLE 40	Sweden market by product (USD Million), 2012 – 2020
TABLE 41	Sweden market by application (USD Million), 2012 – 2020
TABLE 42	Spain market by product (USD Million), 2012 – 2020
TABLE 43	Spain market by application (USD Million), 2012 – 2020
TABLE 44	Poland market by product (USD Million), 2012 – 2020
TABLE 45	Poland market by application (USD Million), 2012 – 2020
TABLE 46	Rest of Europe market by product (USD Million), 2012 – 2020
TABLE 47	Rest of Europe market by application (USD Million), 2012 – 2020

Speak to the report author to design an exclusive study to serve your research needs.
Your personal and confidential information is safe and secure.

