Toll Free: 1-888-928-9744
Toll Free: 1-888-928-9744

Published: Oct, 2015 | Pages:
136 | Publisher: Radiant Insights Inc.
Industry: Personal Care | Report Format: Electronic (PDF)
The Report Contains Contact Lenses Market Size By Product (RPG, Soft, Hybrid), By Design (Spherical, Toric, Multifocal), By Usage (Corrective, Therapeutic, Prosthetic, Lifestyle-oriented) Competitive Analysis & Forecast, 2012 - 2020 Industry Overview Global contact lenses market size is expected to reach USD 12,476.3 million by 2020, growing at a CAGR of 6.7% from 2014 to 2020. Increasing number of ophthalmic disorders especially in children is expected to drive demand growth over the next six years. Children with visual deficiencies are driving for expansion of the wearer base. In addition, ageing population suffering from presbyopes is also accountable for the increase in the usage of contact lenses globally. Global increase in demand for plano or non-Rx sunglasses is expected to fuel contact lenses market growth over the forecast period. According to the American Optometric Association (AOA), prolonged exposure to solar radiation increases the risk of macular degeneration. Plano or non-RX sunglasses are used to avoid adverse effects of solar radiation and protect the eyes from UV rays which eventually boost the overall demand. Moreover, rising awareness among the general population regarding the importance of protecting the eyes is also expected to boost plano sunglasses penetration on a global scale. Plano sunglasses shipments were 296.5 million units in 2013, and are expected to reach 394.7 million units by 2020, growing at a CAGR of 4.2% from 2014 to 2020. Increasing demand in outdoor activities is expected to drive growth over the next six years. Outdoor activities include sports, in which spectacles prove to be a cumbersome option, which has amplified the adoption of contact lenses globally. Benefits provided by contact lenses in outdoor activities include unobstructed field of view, enhanced peripheral vision, less likelihood of injury, high clarity regardless of environmental conditions and higher compatibility with safety equipment among others. In addition to the above advantages, the use of daily disposable lenses for outdoor activities effectively eliminates need for using lens care solutions and storage. Growing acceptance of refractive surgeries is posing a challenge to the growth of the contact lenses market. Refractive surgery such as LASIK (Laser-Assisted in Situ Keratomileusis) diminishes the dependency on contact lenses. According to the American Academy of Ophthalmology (AAO), more than 700,000 LASIK procedures were performed in the U.S. in 2009, which has increased to approximately 800,000 in 2011. However, with the increasing fashion trends of colored lenses and unsuccessful surgeries, the impact of refractive surgeries is expected to reduce in the forecast period.North America contact lenses market, by Design, 2012-2020 (Million units)Design Overview Spherical design was the leading design segment and was valued over USD 6,200 million in 2014. North America dominated the regional market in terms of volume, with over a demand of 240 million units in 2014, growing at a CAGR of 2.9% from 2014 to 2020. Multifocal design was the fastest growing design segment and accounted for over 5% of the market in 2014 growing at an estimated CAGR of over 6 % from 2014 to 2020. The demand for multifocal lenses is expected to increase due to its ability of incorporating multiple prescriptions in one lens. In addition, multifocal design lenses are chiefly useful for age-related ophthalmic disorders such as presbyopia. Product Overview Soft contact lenses were the leading product segment and were valued over USD 7,500 million in 2014. These are made up of flexible, soft plastics such as silicone hydrogel, which provide easy flexibility to the eye. It also enhances the comfort of consumers. In addition, it allows additional oxygen to pass through to the wearer’s cornea and is used extensively for ametropia correction. Soft lenses are further segmented into daily disposable, weekly, monthly, annual, extended wear and unplanned replacement schedule. RGP lenses was the second largest product segment and accounted for over 8% of the overall revenue in 2014 growing at an estimated CAGR of over 4.8% from 2014 to 2020. Less expensive and have higher durability are the factors responsible for the significant growth of RGP lenses globally. In addition, it also offers cleaner vision and is mainly used to correct astigmatism and related corneal defects. Usage Overview Corrective lenses are the highest revenue generators as well as the fastest growing usage segment. Corrective lenses were valued over USD 3,600 million in 2014, growing at a CAGR of over 7% from 2014 to 2020. It is available in various lens types including single vision, bifocal, trifocal, progressive, and adjustable focus. The demand for corrective lenses is increasing owing to rising number of ophthalmic disorders globally. Therapeutic Lenses is the second largest usage segment and was valued over USD 2,900 million in 2014, growing at a CAGR of 6% from 2014 to 2020. In 2014, the market share of cosmetic and prosthetic was over 10% and 6% respectively. Regional Overview North America contact lenses market dominated demand with valuation of over USD 3,100 million in 2014. This region is expected to witness higher growth rates owing to high awareness regarding eye examinations. In addition, presence of key industry participants such as CIBA Vision (Alcon), Johnson & Johnson, CooperVision and Bausch + Lomb in this region has increased demand for high-end premium priced products and also resulted in high brand awareness. Europe was the second largest regional industry and accounted for over 30% of the total demand in 2014. Asia Pacific contact lenses market is expected to be the fastest growing regional industry, at an estimated CAGR of over 3% from 2014 to 2020. This is primarily due to increasing instances of myopia among the adults. Moreover, awareness regarding the importance of protecting the eyes against harmful UV radiation is also driving demand in the region. Competitive Market Share The global contact lenses market share is highly consolidated, with the top four companies accounting for over 90% of the total demand in 2013. Johnson & Johnson emerged as the leading company in the global market and accounted for over 40% of the total consumption in 2013 while CIBA accounted for over 24%. CooperVision and Bausch + Lomb accounted for approximately 16% and 14% of the overall share in 2013. Rest of the companies such as Abbott Medical Optics, Inc., Alcon Laboratories, Inc., Carl Zeiss AG, Eagle Optics Pvt. Limited and Essilor International S.A among others accounted for approximately over 10% of the industry share in 2013.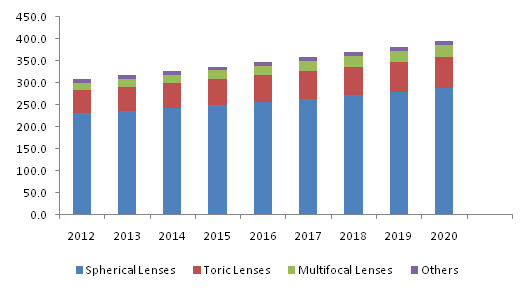
 Table of Contents

Chapter 1 Executive Summary
	1.1 Contact Lenses – Industry Summary & Critical Success Factors (CSFs)

Chapter 2 Contact Lenses Industry Overview
	2.1 Market Segmentation
	2.2 Market Size and Growth Prospects
	2.3 Contact Lenses Value Chain Analysis
	2.4 Contact Lenses Market Dynamics
	2.5 Key Opportunities Prioritized
	2.6 Industry Analysis - Porter's
	2.7 Contact Lenses - Company Market Share Analysis
	2.8 Contact Lenses - PESTEL Analysis
2.9 Contact Lenses – Distribution Channel Analysis

Chapter 3 Contact Lenses Product Overview
3.1 Rigid Gas Permeable (RGP) Contact Lenses
3.2 Soft Contact Lenses
	3.2.1 Soft Contact Lenses Modality Outlook
		3.2.1.1 Daily Disposable
		3.2.1.2 Weekly (and two weeks)
		3.2.1.3 Monthly
		3.2.1.4 Annual
		3.2.1.5 Extended Wear
		3.2.1.6 Unplanned Replacement Schedule
3.3 Hybrid Contact Lenses

Chapter 4 Contact Lenses Design Overview
	4.1 Spherical
	4.2 Toric
	4.3 Multifocal
	4.4 Others

Chapter 5 Contact Lenses Usage Overview
	5.1 Corrective Lenses
	5.2 Therapeutic Lenses
	5.3 Cosmetic Lenses
	5.4 Prosthetic Lenses
	5.5 Lifestyle-oriented Lenses

Chapter 6 Contact Lenses Regional Overview
	6.1 North America
	6.2 Europe
	6.3 Asia Pacific
	6.4 RoW

Chapter 7 Competitive Landscape
	7.1 Revenue Analysis
	7.2 Product Benchmarking
	7.3 Strategic Developments

Chapter 8 Methodology & Scope
	8.1 Research Methodology
	8.2 Research Scope & Assumptions
	8.3 List of Data Sources

Companies analyzed in Chapter 7
1)	Abbott Medical Optics, Inc.
2)	Alcon Laboratories, Inc.
3)	Bausch & Lomb
4)	Carl Zeiss AG
5)	CIBA Vision
6)	Contamac U.S.
7)	CooperVision
8)	Eagle Optics Pvt. Limited
9)	Essilor International
10)	Hoya Corporation
11)	Hydrogel Vision Corp
12)	Johnson & Johnson
13)	Medennium Inc.
14)	STAAR Surgical Company
15)	SynergEyes, Inc.
List of Tables

1.	Contact Lenses – Industry Summary & Critical Success Factors (CSFs)
2.	Global Contact Lenses Market (Volume & Revenue), 2012 - 2020
3.	Global Contact Lenses Market Volume by Region (Million Units), 2012 – 2020
4.	Global Contact Lenses Market Revenue by Region (USD Million), 2012 – 2020
5.	Global Contact Lenses Market Volume by Product (Million Units), 2012 – 2020
6.	Global Contact Lenses Market Revenue by Product (USD Million), 2012 – 2020
7.	Global Contact Lenses Market Volume by Design (Million Units), 2012 – 2020
8.	Global Contact Lenses Market Revenue by Design (USD Million), 2012 – 2020
9.	Global Contact Lenses Market Volume by Usage (Million Units), 2012 – 2020
10.	Global Contact Lenses Market Revenue by Usage (USD Million), 2012 – 2020
11.	Global RGP contact lenses demand (Volume & Revenue), 2012 - 2020
12.	Global RGP contact lenses demand by region (Volume), 2012 – 2020
13.	Global RGP contact lenses demand by region (Revenue), 2012 – 2020
14.	Global soft contact lenses demand (Volume & Revenue), 2012 - 2020
15.	Global soft contact lenses demand by region (Volume), 2012 – 2020
16.	Global soft contact lenses demand by region (Revenue), 2012 – 2020
17.	Global daily disposable contact lenses demand (Volume & Revenue), 2012 - 2020
18.	Global daily disposable contact lenses demand by region (Volume), 2012 – 2020
19.	Global daily disposable contact lenses demand by region (Revenue), 2012 – 2020
20.	Global weekly contact lenses demand (Volume & Revenue), 2012 - 2020
21.	Global weekly contact lenses demand by region (Volume), 2012 – 2020
22.	Global weekly contact lenses demand by region (Revenue), 2012 – 2020
23.	Global monthly contact lenses demand (Volume & Revenue), 2012 - 2020
24.	Global monthly contact lenses demand by region (Volume), 2012 – 2020
25.	Global monthly contact lenses demand by region (Revenue), 2012 – 2020
26.	Global annual contact lenses demand (Volume & Revenue), 2012 - 2020
27.	Global annual contact lenses demand by region (Volume), 2012 – 2020
28.	Global annual contact lenses demand by region (Revenue), 2012 – 2020
29.	Global extended wear contact lenses demand (Volume & Revenue), 2012 - 2020
30.	Global extended wear contact lenses demand by region (Volume), 2012 – 2020
31.	Global extended wear contact lenses demand by region (Revenue), 2012 – 2020
32.	Global unplanned replacement contact lenses demand (Volume & Revenue), 2012 - 2020
33.	Global unplanned replacement contact lenses demand by region (Volume), 2012 – 2020
34.	Global unplanned replacement contact lenses demand by region (Revenue), 2012 – 2020
35.	Global hybrid contact lenses demand (Volume & Revenue), 2012 - 2020
36.	Global hybrid contact lenses demand by region (Volume), 2012 – 2020
37.	Global hybrid contact lenses demand by region (Revenue), 2012 – 2020
38.	Global spherical contact lenses demand (Volume & Revenue), 2012 - 2020
39.	Global spherical contact lenses demand by region (Volume), 2012 – 2020
40.	Global spherical contact lenses demand by region (Revenue), 2012 – 2020
41.	Global toric contact lenses demand (Volume & Revenue), 2012 - 2020
42.	Global toric contact lenses demand by region (Volume), 2012 – 2020
43.	Global toric contact lenses demand by region (Revenue), 2012 – 2020
44.	Global multifocal contact lenses demand (Volume & Revenue), 2012 - 2020
45.	Global multifocal contact lenses demand by region (Volume), 2012 – 2020
46.	Global multifocal contact lenses demand by region (Revenue), 2012 – 2020
47.	Global other contact lenses demand (Volume & Revenue), 2012 - 2020
48.	Global other contact lenses demand by region (Volume), 2012 – 2020
49.	Global other contact lenses demand by region (Revenue), 2012 – 2020
50.	Global corrective contact lenses demand (Volume & Revenue), 2012 - 2020
51.	Global corrective contact lenses demand by region (Volume), 2012 – 2020
52.	Global corrective contact lenses demand by region (Revenue), 2012 – 2020
53.	Global therapeutic contact lenses demand (Volume & Revenue), 2012 - 2020
54.	Global therapeutic contact lenses demand by region (Volume), 2012 – 2020
55.	Global therapeutic contact lenses demand by region (Revenue), 2012 – 2020
56.	Global cosmetic contact lenses demand (Volume & Revenue), 2012 - 2020
57.	Global cosmetic contact lenses demand by region (Volume), 2012 – 2020
58.	Global cosmetic contact lenses demand by region (Revenue), 2012 – 2020
59.	Global prosthetic contact lenses demand (Volume & Revenue), 2012 - 2020
60.	Global prosthetic contact lenses demand by region (Volume), 2012 – 2020
61.	Global prosthetic contact lenses demand by region (Revenue), 2012 – 2020
62.	Global lifestyle-oriented contact lenses demand (Volume & Revenue), 2012 - 2020
63.	Global lifestyle-oriented contact lenses demand by region (Volume), 2012 – 2020
64.	Global lifestyle-oriented contact lenses demand by region (Revenue), 2012 – 2020
65.	Global spectacles frames demand by region (Volume), 2012 – 2020
66.	North America contact lenses market by product (Volume), 2012 – 2020
67.	North America contact lenses market by product (Revenue), 2012 – 2020
68.	North America contact lenses market by design (Volume), 2012 – 2020
69.	North America contact lenses market by design (Revenue), 2012 – 2020
70.	North America contact lenses market by usage (Volume), 2012 – 2020
71.	North America contact lenses market by usage (Revenue), 2012 – 2020
72.	Europe contact lenses market by product (Volume), 2012 – 2020
73.	Europe contact lenses market by product (Revenue), 2012 – 2020
74.	Europe contact lenses market by design (Volume), 2012 – 2020
75.	Europe contact lenses market by design (Revenue), 2012 – 2020
76.	Europe contact lenses market by usage (Volume), 2012 – 2020
77.	Europe contact lenses market by usage (Revenue), 2012 – 2020
78.	Asia Pacific contact lenses market by product (Volume), 2012 – 2020
79.	Asia Pacific contact lenses market by product (Revenue), 2012 – 2020
80.	Asia Pacific contact lenses market by design (Volume), 2012 – 2020
81.	Asia Pacific contact lenses market by design (Revenue), 2012 – 2020
82.	Asia Pacific contact lenses market by usage (Volume), 2012 – 2020
83.	Asia Pacific contact lenses market by usage (Revenue), 2012 – 2020
84.	RoW contact lenses market by product (Volume), 2012 – 2020
85.	RoW contact lenses market by product (Revenue), 2012 – 2020
86.	RoW contact lenses market by design (Volume), 2012 – 2020
87.	RoW contact lenses market by design (Revenue), 2012 – 2020
88.	RoW contact lenses market by usage (Volume), 2012 – 2020
89.	RoW contact lenses market by usage (Revenue), 2012 – 2020

List of Figures

1.	Contact Lenses Market Segmentation
2.	Global Contact Lenses Market (Volume & Revenue), 2012 - 2020
3.	Contact Lenses Value Chain Analysis
4.	Contact Lenses Market Dynamics
5.	Contact Lenses Company Market Share Analysis, 2012
6.	Key Opportunities Prioritized
7.	Industry Analysis - Porter's
8.	Contact Lenses PESTEL Analysis, 2012
9.	Contact Lenses Distribution Channel Analysis
10.	Contact Lenses market share by product, 2012 & 2020
11.	Global RGP contact lenses market demand (Volume & Revenue), 2012 – 2020
12.	Global soft contact lenses market demand (Volume & Revenue), 2012 – 2020
13.	Global hybrid contact lenses market demand (Volume & Revenue), 2012 – 2020
14.	Contact Lenses market share by design, 2012 & 2020
15.	Global spherical contact lenses market demand (Volume & Revenue), 2012 – 2020
16.	Global toric contact lenses market demand (Volume & Revenue), 2012 – 2020
17.	Global multifocal contact lenses market demand (Volume & Revenue), 2012 – 2020
18.	Global other contact lenses market demand (Volume & Revenue), 2012 – 2020
19.	Contact Lenses market share by usage, 2012 & 2020
20.	Global corrective contact lenses market demand (Volume & Revenue), 2012 – 2020
21.	Global therapeutic contact lenses market demand (Volume & Revenue), 2012 – 2020
22.	Global cosmetic contact lenses market demand (Volume & Revenue), 2012 – 2020
23.	Global prosthetic contact lenses market demand (Volume & Revenue), 2012 – 2020
24.	Global lifestyle-oriented contact lenses market demand (Volume & Revenue), 2012 – 2020
25.	Contact Lenses market share by region, 2012 & 2020
26.	North America contact lenses market volume, by product, 2012 – 2020
27.	North America contact lenses market revenue, by product, 2012 – 2020
28.	North America contact lenses market volume, by design, 2012 – 2020
29.	North America contact lenses market revenue, by design, 2012 - 2020
30.	North America contact lenses market volume, by usage, 2012 – 2020
31.	North America contact lenses market revenue, by usage, 2012 – 2020
32.	Europe contact lenses market volume, by product, 2012 – 2020
33.	Europe contact lenses market revenue, by product, 2012 – 2020
34.	Europe contact lenses market volume, by design, 2012 – 2020
35.	Europe contact lenses market revenue, by design, 2012 - 2020
36.	Europe contact lenses market volume, by usage, 2012 – 2020
37.	Europe contact lenses market revenue, by usage, 2012 - 2020
38.	Asia Pacific contact lenses market volume, by product, 2012 – 2020
39.	Asia Pacific contact lenses market revenue, by product, 2012 – 2020
40.	Asia Pacific contact lenses market volume, by design, 2012 – 2020
41.	Asia Pacific contact lenses market revenue, by design, 2012 - 2020
42.	Asia Pacific contact lenses market volume, by usage, 2012 – 2020
43.	Asia Pacific contact lenses market revenue, by usage, 2012 - 2020
44.	RoW contact lenses market volume, by product, 2012 – 2020
45.	RoW contact lenses market revenue, by product, 2012 – 2020
46.	RoW contact lenses market volume, by design, 2012 – 2020
47.	RoW contact lenses market revenue, by design, 2012 - 2020
48.	RoW contact lenses market volume, by usage, 2012 – 2020
49.	RoW contact lenses market revenue, by usage, 2012 - 2020

Speak to the report author to design an exclusive study to serve your research needs.
Your personal and confidential information is safe and secure.

