Toll Free: 1-888-928-9744
Toll Free: 1-888-928-9744

Published: Oct, 2015 | Pages:
89 | Publisher: Radiant Insights Inc.
Industry: Chemicals | Report Format: Electronic (PDF)
The Report Contains Biocides Market Size By Application (Water treatment, Food & beverage, Personal care, Wood Preservation, Paints & Coatings, HVAC, Boilers, Oil & Gas, Fuels), By Product (Halogens, Metallic Compounds, Organosulfurs, Organic acids, Phenolic, Nitrogen), Competitive Analysis & Forecast, 2012 - 2022 Industry Overview Global biocides market size is expected to exceed USD 11.9 billion by 2022, witnessing gains at over 5% from 2015 to 2022. Dynamic growth in the industrial sector from water treatment, personal care and paints & coatings is expected to drive industry demand. Strong demand for water treatment processes in India, Japan and China is anticipated to positively impact growth. Rising health awareness related to bacterial growth and pathogens is likely to support biocides market growth over the forecast period. Global coatings market was valued at USD 113.7 million in 2013 and is estimated to be USD 145.8 million by 2022. Strong paints & coatings demand, on account of increasing use in construction and infrastructural developments in emerging markets is expected to boost growth. Biocides are synthetic or natural compounds used as pesticides, antimicrobial, antifouling and disinfecting agent. Halogens such as iodine, bromine and chlorine, metals, ozone, acrolein, amines, phenolic compounds, copper salts, organosulfur compounds and quaternary ammonium salts are the key raw materials used for production of biocides. Raw materials and their concentration vary with specific products and applications. Suppliers are focusing on application specific products, with different grades being developed that can cater to a wide range of applications. Stringent regulatory outlook, with respect to the U.S. EPA and REACH regarding composition and use may challenge industry participants.Europe biocide market, by application, 2012-2022 (USD Million)Application Overview Water treatment, accounting for 23.4% of global biocides market revenue in 2014 was the largest application segment. Strong demand for treating microbial activity, scaling, corrosion and disposal in water treatment is expected to support industry demand over the next seven years. Unmet needs to restrict microbial growth, along with application growth of preservatives in packaged and frozen food are expected to be a favorable factor for industry in the near future. Personal care industry was a large avenue for participants in 2014, accounting for 14.4% of global revenue. Product Overview Halogen compounds were most widely used in 2014 accounting for over 27% of total biocides market. These are mostly used in municipal and industrial waste water treatment along with cooling systems. These biocides are expected to witness slack growth owing to stringent regulations regarding halogen emissions by various regulatory agencies. Global metallic compound biocides were valued at USD 1,544.4 million in 2014 and predominantly used as disinfectants in cooling towers and water treatment plants. Stringent regulations regarding use of halogens is expected to amplify the importance of metallic compounds as a substitute in the near future. Organosulfurs possess antifungal and antibacterial properties due to which they are majorly used in the healthcare industry to inhibit the growth microorganisms on plastic or metal surfaces. Regional Overview North America consumed over 40% of global revenue in 2014, owing to the presence of various end use industries, with U.S. biocides market valued at USD 2.63 billion. Halogen compounds were widely used in the region and generated revenue of USD 878.9 million in 2014. Demand in Europe was dominated by halogens and metallic compounds in 2014, together accounting for over 43%. Phenolic products are expected to be the fastest growing segment in Asia Pacific, at a CAGR of 8.6% owing to high demand for triclosan, a phenol based compound used in liquid soaps. Competitive Market Share Global biocides market share is fairly consolidated, with four participants catering to over 58% of overall consumption in 2014. Key market players include Ashland, Troy, Arch Chemicals, Dow and Thor Specialities. Others chemical companies such as BASF, AkzoNobel, Albemarle, Lanxess and Champion Technologies together accounted for just over 32% of the overall demand in 2014. The market is somewhat fragmented on a regional level, especially in Asia with a presence of a host of domestic suppliers which make up the unorganized sector.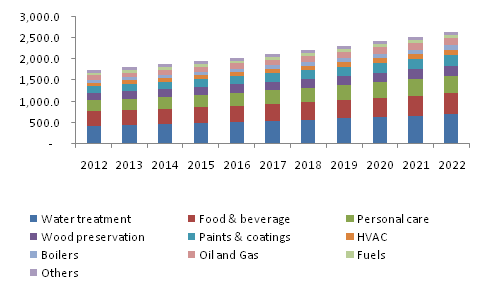
 Table of Contents

Chapter 1.	Methodology and Scope
1.1.	Research Methodology
1.2.	Research Scope & Assumptions
1.3.	List of Data Sources

Chapter 2.	Executive Summary
2.1.	Biocide Market - Industry Summary and Key Buying Criteria, 2012 - 2022

Chapter 3.	Biocide Industry Overview
3.1.	Biocide market segmentation
3.2.	Biocide market size and growth prospects, 2012 - 2022
3.3.	Biocide market value chain analysis
3.4.	Biocide market dynamics
3.4.1.	Market driver analysis
3.4.1.1.	Growing water demand
3.4.1.2.	Growth of paints & coatings industry
3.4.1.3.	Boom in oil & gas industry
3.4.1.4.	Rising demand for food & beverages
3.4.2.	Market restraint analysis
3.4.2.1.	Stringent regulatory framework
3.5.	Biocide market – Key opportunities prioritized
3.6.	Biocide market Porter’s analysis
3.7.	Biocide company market share analysis, 2014
3.8.	Biocide market PESTEL analysis

Chapter 4.	Biocide Product Overview
4.1.	Global biocide market share by product, 2014 & 2022
4.2.	Halogen compounds
4.2.1.	Market estimates and forecast, 2012 - 2022
4.2.2.	Market estimates and forecast, by region, 2012 – 2022
4.3.	Metallic compounds
4.3.1.	Market estimates and forecast, 2012 - 2022
4.3.2.	Market estimates and forecast, by region, 2012 – 2022
4.4.	Organosulfur
4.4.1.	Market estimates and forecast, 2012 - 2022
4.4.2.	Market estimates and forecast, by region, 2012 – 2022
4.5.	Organic acids
4.5.1.	Market estimates and forecast, 2012 - 2022
4.5.2.	Market estimates and forecast, by region, 2012 – 2022
4.6.	Phenolic
4.6.1.	Market estimates and forecast, 2012 - 2022
4.6.2.	Market estimates and forecast, by region, 2012 – 2022
4.7.	Nitrogen
4.7.1.	Market estimates and forecast, 2012 - 2022
4.7.2.	Market estimates and forecast, by region, 2012 – 2022
4.8.	Others
4.8.1.	Market estimates and forecast, 2012 - 2022
4.8.2.	Market estimates and forecast, by region, 2012 – 2022

Chapter 5.	Biocide Application Overview
5.1.	Global biocide market share by application, 2014 & 2022
5.2.	Water treatment
5.2.1.	Market estimates and forecast, 2012 - 2022
5.2.2.	Market estimates and forecast, by region, 2012 – 2022
5.3.	Food & beverage
5.3.1.	Market estimates and forecast, 2012 - 2022
5.3.2.	Market estimates and forecast, by region, 2012 – 2022
5.4.	Personal care
5.4.1.	Market estimates and forecast, 2012 - 2022
5.4.2.	Market estimates and forecast, by region, 2012 – 2022
5.5.	Wood preservation
5.5.1.	Market estimates and forecast, 2012 - 2022
5.5.2.	Market estimates and forecast, by region, 2012 – 2022
5.6.	Paints & coatings
5.6.1.	Market estimates and forecast, 2012 - 2022
5.6.2.	Market estimates and forecast, by region, 2012 – 2022
5.7.	HVAC
5.7.1.	Market estimates and forecast, 2012 - 2022
5.7.2.	Market estimates and forecast, by region, 2012 – 2022
5.8.	Boilers
5.8.1.	Market estimates and forecast, 2012 - 2022
5.8.2.	Market estimates and forecast, by region, 2012 – 2022
5.9.	Oil & gas
5.9.1.	Market estimates and forecast, 2012 - 2022
5.9.2.	Market estimates and forecast, by region, 2012 – 2022
5.10.	Fuels
5.10.1.	Market estimates and forecast, 2012 - 2022
5.10.2.	Market estimates and forecast, by region, 2012 – 2022
5.11.	Others
5.11.1.	Market estimates and forecast, 2012 - 2022
5.11.2.	Market estimates and forecast, by region, 2012 – 2022

Chapter 6.	Biocide Regional Overview
6.1.	Global biocide market share by region, 2014 & 2022
6.2.	North America
6.2.1.	Market estimates and forecast, 2012 - 2022
6.2.2.	Market estimates and forecast, by product, 2012 – 2022
6.2.3.	Market estimates and forecast, by application, 2012 – 2022
6.2.4.	U.S.
6.2.4.1.	Market estimates and forecast, 2012 - 2022
6.2.4.2.	Market estimates and forecast, by product, 2012 – 2022
6.2.4.3.	Market estimates and forecast, by application, 2012 – 2022
6.2.5.	Canada
6.2.5.1.	Market estimates and forecast, 2012 - 2022
6.2.5.2.	Market estimates and forecast, by product, 2012 – 2022
6.2.5.3.	Market estimates and forecast, by application, 2012 – 2022
6.2.6.	Mexico
6.2.6.1.	Market estimates and forecast, 2012 - 2022
6.2.6.2.	Market estimates and forecast, by product, 2012 – 2022
6.2.6.3.	Market estimates and forecast, by application, 2012 – 2022
6.3.	Europe
6.3.1.	Market estimates and forecast, 2012 - 2022
6.3.2.	Market estimates and forecast, by product, 2012 – 2022
6.3.3.	Market estimates and forecast, by application, 2012 – 2022
6.3.4.	Germany
6.3.4.1.	Market estimates and forecast, 2012 - 2022
6.3.4.2.	Market estimates and forecast, by product, 2012 – 2022
6.3.4.3.	Market estimates and forecast, by application, 2012 – 2022
6.3.5.	Italy
6.3.5.1.	Market estimates and forecast, 2012 - 2022
6.3.5.2.	Market estimates and forecast, by product, 2012 – 2022
6.3.5.3.	Market estimates and forecast, by application, 2012 – 2022
6.4.	Asia Pacific
6.4.1.	Market estimates and forecast, 2012 - 2022
6.4.2.	Market estimates and forecast, by product, 2012 – 2022
6.4.3.	Market estimates and forecast, by application, 2012 – 2022
6.4.4.	China
6.4.4.1.	Market estimates and forecast, 2012 - 2022
6.4.4.2.	Market estimates and forecast, by product, 2012 – 2022
6.4.4.3.	Market estimates and forecast, by application, 2012 – 2022
6.4.5.	Japan
6.4.5.1.	Market estimates and forecast, 2012 - 2022
6.4.5.2.	Market estimates and forecast, by product, 2012 – 2022
6.4.5.3.	Market estimates and forecast, by application, 2012 – 2022
6.5.	Latin America
6.5.1.	Market estimates and forecast, 2012 - 2022
6.5.2.	Market estimates and forecast, by product, 2012 – 2022
6.5.3.	Market estimates and forecast, by application, 2012 – 2022
6.5.4.	Brazil
6.5.4.1.	Market estimates and forecast, 2012 - 2022
6.5.4.2.	Market estimates and forecast, by product, 2012 – 2022
6.5.4.3.	Market estimates and forecast, by application, 2012 – 2022
6.6.	MEA
6.6.1.	Market estimates and forecast, 2012 - 2022
6.6.2.	Market estimates and forecast, by product, 2012 – 2022
6.6.3.	Market estimates and forecast, by application, 2012 – 2022

Chapter 7.	Competitive Landscape
7.1.	Revenue Analysis
7.2.	Product Benchmarking
7.3.	Strategic Developments
Companies analyzed in Chapter 7
1.	AkzoNobel N.V.
2.	Akcros Chemicals
3.	Albemarle Corporation
4.	Arch Chemicals Inc
5.	Champion Technologies
6.	Lubrizol
7.	Anpath Group Incorporated
8.	Baker Hughes Incorporated
9.	Ashland Inc.
10.	BASF
11.	BWA Water Additives
12.	GE Water and Process Technologies
13.	Solvay SA
14.	Sigma-Aldrich
15.	Thor Group Limited
16.	Buckman Laboratories International Inc
17.	Cortec Corporation
18.	Clariant AG
19.	Troy Corporation
20.	The Dow Chemical Company
21.	Lanxess AG
List of Tables

1.	Biocide Market - Industry Summary and Key Buying Criteria, 2012 - 2022
2.	Global biocide market, 2012 – 2022 (USD Million)
3.	Global biocide market revenue by region, 2012 – 2022, (USD Million)
4.	Global biocide market revenue by product, 2012 – 2022, (USD Million)
5.	Global biocide market revenue by application, 2012 – 2022, (USD Million)
6.	Biocide – Key market driver analysis
7.	Biocide – Key market restraint analysis
8.	Global halogen compound biocide market revenue, 2012-2022, (USD Million)
9.	Global halogen compound biocide market revenue, by region, 2012 – 2022, (USD Million)
10.	Global metallic compound biocide market estimates and forecast, 2012-2022, (USD Million)
11.	Global metallic compound biocide market revenue, by region, 2012 – 2022, (USD Million)
12.	Global organosulfur biocide market estimates and forecast, 2012-2022 (USD Million)
13.	Global organosulfur biocide market revenue, by region, 2012 – 2022, (USD Million)
14.	Global organic acid biocide market estimates and forecast, 2012-2022 (USD Million)
15.	Global organic acid biocide market revenue, by region, 2012 – 2022, (USD Million)
16.	Global phenolic biocide market estimates and forecast, 2012-2022, (USD Million)
17.	Global phenolic biocide market revenue, by region, 2012 – 2022, (USD Million)
18.	Global nitrogen biocide market estimates and forecast, 2012-2022, (USD Million)
19.	Global nitrogen biocide market revenue, by region, 2012 – 2022, (USD Million)
20.	Global other biocide market estimates and forecast, 2012-2022, (USD Million)
21.	Global other biocide market revenue, by region, 2012 – 2022, (USD Million)
22.	Global biocide market estimates and forecast in water treatment, 2012-2022, (USD Million)
23.	Global biocide market revenue in water treatment, by region, 2012 – 2022, (USD Million)
24.	Global biocide market estimates and forecast in food & beverage, 2012-2022, (USD Million)
25.	Global biocide market revenue in food & beverage, by region, 2012 – 2022, (USD Million)
26.	Global biocide market estimates and forecast in personal care, 2012-2020 (USD Million)
27.	Global biocide market revenue in personal care, by region, 2012 – 2022, (USD Million)
28.	Global biocide market estimates and forecast in wood preservation, 2012-2022, (USD Million)
29.	Global biocide market revenue in wood preservation, by region, 2012 – 2022, (USD Million)
30.	Global biocide market estimates and forecast in paints & coatings, 2012-2022, (USD Million)
31.	Global biocide market revenue in paints & coatings, by region, 2020 – 2022, (USD Million)
32.	Global biocide market estimates and forecast in HVAC applications, 2012-2022, (USD Million)
33.	Global biocide market revenue in HVAC applications, by region, 2020 – 2022, (USD Million)
34.	Global biocide market estimates and forecast in boilers, 2012-2022, (USD Million)
35.	Global biocide market revenue in boilers, by region, 2020 – 2022, (USD Million)
36.	Global biocide market estimates and forecast in oil & gas, 2012-2022, (USD Million)
37.	Global biocide market revenue in oil & gas, by region, 2020 – 2022, (USD Million)
38.	Global biocide market estimates and forecast in fuels, 2012-2022, (USD Million)
39.	Global biocide market revenue in fuels, by region, 2020 – 2022, (USD Million)
40.	Global biocide market estimates and forecast in other applications, 2012-2022, (USD Million)
41.	Global biocide market revenue in other applications, by region, 2012 – 2022, (USD Million)
42.	North America biocide market revenue, 2012 – 2022, (USD Million)
43.	North America biocide market revenue by product, 2012 – 2022, (USD Million)
44.	North America biocide market revenue, by application, 2012 – 2022, (USD Million)
45.	U.S. biocide market revenue, 2012 – 2022, (USD Million)
46.	U.S. biocide market revenue, by product, 2012 – 2022, (USD Million)
47.	U.S. biocide market revenue, by application, 2012 – 2022, (USD Million)
48.	Canada biocide market revenue, 2012 – 2022, (USD Million)
49.	Canada biocide market revenue, by product, 2012 – 2022, (USD Million)
50.	Canada biocide market revenue, by application, 2012 – 2022, (USD Million)
51.	Mexico biocide market revenue, 2012 – 2022, (USD Million)
52.	Mexico biocide market revenue by product, 2012 – 2022, (USD Million)
53.	Mexico biocide market revenue, by application, 2012 – 2022, (USD Million)
54.	Europe biocide market revenue, 2012 – 2022, (USD Million)
55.	Europe biocide market revenue by product, 2012 – 2022, (USD Million)
56.	Europe biocide market revenue, by application, 2012 – 2022, (USD Million)
57.	Germany biocide market revenue, 2012 – 2022, (USD Million)
58.	Germany biocide market revenue by product, 2012 – 2022, (USD Million)
59.	Germany biocide market revenue, by application, 2012 – 2022, (USD Million)
60.	Italy biocide market revenue, 2012 – 2022, (USD Million)
61.	Italy biocide market revenue by product, 2012 – 2022, (USD Million)
62.	Italy biocide market revenue, by application, 2012 – 2022, (USD Million)
63.	Asia Pacific biocide market revenue, 2012 – 2022, (USD Million)
64.	Asia Pacific biocide market revenue by product, 2012 – 2022, (USD Million)
65.	Asia Pacific biocide market revenue, by application, 2012 – 2022, (USD Million)
66.	China biocide market revenue, 2012 – 2022, (USD Million)
67.	China biocide market revenue by product, 2012 – 2022, (USD Million)
68.	China biocide market revenue, by application, 2012 – 2022, (USD Million)
69.	Japan biocide market revenue, 2012 – 2022, (USD Million)
70.	Japan biocide market revenue by product, 2012 – 2022, (USD Million)
71.	Japan biocide market revenue, by application, 2012 – 2022, (USD Million)
72.	Latin America biocide market revenue, 2012 – 2020, (USD Million)
73.	Latin America biocide market revenue by product, 2012 – 2022, (USD Million)
74.	Latin America biocide market revenue, by application, 2012 – 2022, (USD Million)
75.	Brazil biocide market revenue, 2012 – 2022, (USD Million)
76.	Brazil biocide market revenue by product, 2012 – 2022, (USD Million)
77.	Brazil biocide market revenue, by application, 2012 – 2022, (USD Million)
78.	MEA biocide market revenue, 2012 – 2022, (USD Million)
79.	MEA biocide market revenue by product, 2012 – 2022, (USD Million)
80.	MEA biocide market revenue, by application, 2012 – 2022, (USD Million)

List of Figures

1.	Biocide market segmentation
2.	Global biocide market revenue, 2012 – 2022 (USD Million)
3.	Biocide market value chain analysis
4.	Biocide market dynamics
5.	Global per capita consumption of water, by region, 2013, (cubic meter per person)
6.	Global coatings market, 2012-2022, (USD Million)
7.	Global oil & gas production, 2008 - 2013, (Million Tons)
8.	Asia Pacific food & beverage market revenue, 2009-2013 (USD Billion)
9.	Biocide market – Key opportunities prioritized
10.	Biocide market Porter’s analysis
11.	Biocide company market share analysis, 2014
12.	Biocide market PESTEL analysis
13.	Global biocide market revenue share by product, 2014 & 2022
14.	Global biocide market volume share by application, 2014 & 2022
15.	Global biocide market volume share by region, 2014 & 2022

Speak to the report author to design an exclusive study to serve your research needs.
Your personal and confidential information is safe and secure.

