Toll Free: 1-888-928-9744
Toll Free: 1-888-928-9744

Published: Oct, 2015 | Pages:
113 | Publisher: Radiant Insights Inc.
Industry: Semiconductors | Report Format: Electronic (PDF)
The Report Contains Automated Test Equipment (ATE) Market Size By Product (Memory ATE, Non-Memory ATE, Discrete ATE), By Application (Automotive, Consumer Electronics, Defense, IT & Telecom, Others), Competitive Analysis & Forecast, 2012 - 2020 Industry Overview Global Automated Test Equipment (ATE) market size is expected to reach USD 4,476.2 million by 2020, growing at a CAGR of 2.5% from 2014 to 2020. Increasing design complexity coupled with need for effective testing is expected to drive demand growth over the next six years. It offers more features and amplified device integration. Increasing consumer demand for improved functionality, bandwidth, and performance designing are factors responsible for the industry growth. In addition, manufacturers are adopting high-level product differentiation that invariably demands high complexity in ATE designs. Increasing need for optimizing power management in order to ensure longer battery life for consumer electronic devices is expected to fuel ATE market growth over the forecast period. The expansion of smartphones, tablets and system-on-chip (SoC) based products is generating demand for greater functionality. Smartphone proliferation has also been instrumental in escalating the demand for semiconductors, which has further fostered automated test equipment market. Key test point techniques analyzed and reported in this automated test equipment market report include wafer probing, burn-in and final test. Wafer probing is expected to lose share over the forecast period. It accounted for over 39% of the overall share in 2013. This can be attributed to the miniaturization of semiconductor devices and significant cost-benefits associated. Final test accounted for over 33% of the overall share in 2013. Strong need for effective testing is expected to spur demand over the forecast period from 2014 to 2020. The benefits offered by semiconductor testing include reduced-cost, miniaturization of components, improved flexibility, modularity, technical capability and reliability. Besides this, high-level integration including RF and wireless technology and rapid product development are the new norms driving the demand for effective testing solutions. In addition, technological proliferation, increasing consumer demand for improved product functionality and the need to gain competitive advantage have bolstered the need for effective testing solutions. Dependency on semiconductor chips is expected to pose a challenge to the growth of ATE market. The fluctuations in demand for semiconductor chips has led to a gap in the demand and supply, thus industry participants experience volatile revenue that adversely affects their profitability. For instance, in 2011, reduction in production of electronic products owing to natural disasters such as the floods in Thailand and the Great East Japan Earthquake has resulted in significant losses for industry participants.North America ATE market size, by product, 2012-2020 (USD Million)Product Overview Non-memory was the leading ATE market product segment and was valued over USD 2,000.0 million in 2013. This can be attributed to the expansion of consumer electronics, increasing automotive demand and growing number of microcontroller-based applications. Memory was the second largest product segment and was valued over USD 800.0 million in 2013, growing at a rate of over 1% from 2014 to 2020. The cyclical variations in growth rates than non-memory semiconductors have resulted in gaining popularity among various applications. Discrete is fastest growing product segment and expected to reach over USD 120.0 million by 2020. Application Overview IT & telecommunication industry is the highest revenue generator application segment. It was valued over USD 1,500.0 million in 2013 and expected to reach over USD 2,000.0 million by 2020. ATE enables Telecom Equipment Manufacturers (TEMs) in ensuring consistent quality for their products, and Communication Service Providers (CSPs) to enhance their network in order to support new technologies. Consumer electronics sector is the second largest application segment and was valued over USD 1,000.0 million in 2013, growing at a CAGR of over 3% from 2014 to 2020. Increasing popularity of consumer devices such as tablets, smartphones and computers is expected to be the key growth driver. Defense sector is the fastest growing application sector and expected to reach over USD 170.0 million by 2020. Regional Overview Asia Pacific automated test equipment market dominated demand with valuation of over USD 2,000.0 million in 2013, growing at a CAGR of over 2% from 2014 to 2020. This can be attributed to a large number of semiconductor industries in the region. In addition, innovations in technology and changing customer needs have also contributed positively towards the regional growth. North America was the second largest regional industry and accounted for over 15% of the total demand share in 2013. Heavy investment in innovation for defense applications, along with developments in the telecommunication sector is expected to drive the region over the forecast period. Competitive Market Share The global automated test equipment market share is highly consolidated, with the top three companies accounting for over 80% of the total share in 2013. Teradyne Inc. emerged as the leading company in the global industry and accounted for over 40% of the total consumption in 2013. Rest of the companies such as Advantest Corporation, LTX-Credence Corporation, Yokogawa, Aeroflex Inc., Advint LLC, Anritsu Co., Cal-Bay Systems and National Instruments Corp. among others accounted for approximately 60% of the industry share in 2013.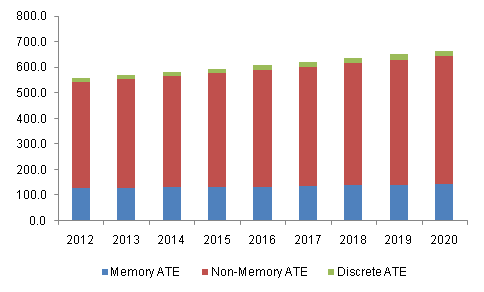
 Table of Contents

Chapter 1	Executive Summary
1.1	ATE – Industry Summary & Critical Success Factors (CSFs)

Chapter 2	ATE Industry Overview
2.1	Market segmentation
2.2	Market Size and Growth Prospects
2.3	ATE - Value Chain Analysis
2.4	ATE – Market dynamics
2.4.1	Market driver analysis
2.4.1.1	Increasing range of consumer devices
2.4.1.2	Increasing design complexity
2.4.1.3	Need for effective testing
2.4.2	Market restraint analysis
2.4.2.1	Cyclical variations in the semiconductor industry
2.5	Key opportunities - Prioritized
2.6	Industry Analysis – Porter’s
2.7	ATE - Company market share analysis, 2013
2.8	ATE – PESTEL Analysis

Chapter 3	ATE Product Overview
3.1	ATE market share by product, 2013 & 2020
3.2	Memory ATE
3.3	Non-Memory ATE
3.4	Discrete ATE

Chapter 4	ATE Application Overview
4.1	ATE market share by application, 2013 & 2020
4.2	Automotive
4.3	Consumer
4.4	Defense
4.5	IT & Telecom
4.6	Others

Chapter 5	ATE Test Point Overview
5.1	Global ATE market share by test point, 2013 & 2020
5.2	Global ATE market, by test point, (USD Million), 2012 - 2020

Chapter 6	ATE Regional Overview
6.1	ATE market share by region, 2013 & 2020
6.2	North America
6.2.1	North America ATE market by product, 2012 – 2020
6.2.2	North America ATE market by application, 2012 – 2020
6.3	Europe
6.3.1	Europe ATE market by product, 2012 – 2020
6.3.2	Europe ATE market by application, 2012 – 2020
6.4	Asia Pacific
6.4.1	Asia Pacific ATE market by product, 2012 – 2020
6.4.2	Asia Pacific ATE market by application, 2012 – 2020
6.5	RoW
6.5.1	RoW ATE market by product, 2012 – 2020
6.5.2	RoW ATE market by application, 2012 – 2020

Chapter 7	Competitive Landscape
7.1	Advantest Co.
7.1.1	Company Overview
7.1.2	Financial Performance
7.1.3	Product Benchmarking
7.1.4	Strategic Initiatives
7.2	Advint LLC
7.2.1	Company Overview
7.2.2	Financial Performance
7.2.3	Product Benchmarking
7.2.4	Strategic Initiatives
7.3	Aeroflex Inc.
7.3.1	Company Overview
7.3.2	Financial Performance
7.3.3	1.1.3 Product Benchmarking
7.3.4	Strategic Initiatives
7.4	Agilent Technologies Inc.(Keysight Technologies)
7.4.1	Company Overview
7.4.2	Financial Performance
7.4.3	Product Benchmarking
7.4.4	Strategic Initiatives
7.5	Anritsu Corporation
7.5.1	Company Overview
7.5.2	Financial Performance
7.5.3	Product Benchmarking
7.5.4	Strategic Initiatives
7.6	Cal-Bay Systems (Averna)
7.6.1	Company Overview
7.6.2	Financial Performance
7.6.3	Product Benchmarking
7.6.4	Strategic Initiatives
7.7	LTX-Credence Corporation (Xcerra Corporation)
7.7.1	Company Overview
7.7.2	Financial Performance
7.7.3	Product Benchmarking
7.7.4	Strategic Initiatives
7.8	National Instruments Corporation
7.8.1	Company Overview
7.8.2	Financial Performance
7.8.3	Product Benchmarking
7.8.4	Strategic Initiatives
7.9	Rohde & Schwarz GmbH & Co. KG.
7.9.1	Company Overview
7.9.2	Financial Performance
7.9.3	Product Benchmarking
7.9.4	Strategic Initiatives
7.10	SPEA S.p.A
7.10.1	Company Overview
7.10.2	Financial Performance
7.10.3	Product Benchmarking
7.10.4	Strategic Initiatives
7.11	Teradyne Inc.
7.11.1	Company Overview
7.11.2	Financial Performance
7.11.3	Product Benchmarking
7.11.4	Strategic Initiatives

Chapter 8	Methodology and Scope
8.1	Research Methodology
8.2	Research Scope & Assumptions
8.3	List of Data Sources
List of Tables

TABLE 1	Global ATE market, (USD Million), 2012 - 2020
TABLE 2	Global ATE market by region, (USD Million), 2012 - 2020
TABLE 3	Global ATE market by product, (USD Million), 2012 - 2020
TABLE 4	Global ATE market by application, (USD Million), 2012 - 2020
TABLE 5	ATE – Key market driver impact
TABLE 6	ATE – Key market restraint impact
TABLE 7	Global memory ATE market (USD Million), 2012 - 2020
TABLE 8	Global memory ATE market by region (USD Million), 2012 - 2020
TABLE 9	Global non-memory ATE market (USD Million), 2012 - 2020
TABLE 10	Global non-memory ATE market by region (USD Million), 2012 - 2020
TABLE 11	Global discrete ATE market (USD Million), 2012 - 2020
TABLE 12	Global discrete ATE market by region (USD Million), 2012 - 2020
TABLE 13	Global ATE market demand in automotive (USD Million), 2012 - 2020
TABLE 14	Global ATE market demand in automotive by region (USD Million), 2012 - 2020
TABLE 15	Global ATE market demand in consumer applications (USD Million), 2012 - 2020
TABLE 16	Global ATE market demand in consumer applications by region (USD Million), 2012 - 2020
TABLE 17	Global ATE market demand in defense (USD Million), 2012 - 2020
TABLE 18	Global ATE market demand in defense by region (USD Million), 2012 - 2020
TABLE 19	Global ATE market demand in IT & telecom (USD Million), 2012 - 2020
TABLE 20	Global ATE market demand in IT & telecom by region (USD Million), 2012 - 2020
TABLE 21	Global ATE market demand in other applications (USD Million), 2012 - 2020
TABLE 22	Global ATE market demand in other applications by region (USD Million), 2012 - 2020
TABLE 23	Global ATE market by test point (USD Million), 2012 - 2020
TABLE 24	North America ATE market by product (USD Million), 2012 – 2020
TABLE 25	North America ATE market by application (USD Million), 2012 – 2020
TABLE 26	Europe ATE market by product (USD Million), 2012 – 2020
TABLE 27	Europe ATE market by application (USD Million), 2012 – 2020
TABLE 28	Asia Pacific ATE market by product (USD Million), 2012 – 2020
TABLE 29	Asia Pacific ATE market by application (USD Million), 2012 – 2020
TABLE 30	RoW ATE market by product (USD Million), 2012 – 2020
TABLE 31	RoW ATE market by application (USD Million), 2012 – 2020

Speak to the report author to design an exclusive study to serve your research needs.
Your personal and confidential information is safe and secure.

