Toll Free: 1-888-928-9744
Toll Free: 1-888-928-9744

Published: Oct, 2015 | Pages:
92 | Publisher: Radiant Insights Inc.
Industry: Petrochemicals | Report Format: Electronic (PDF)
The Reports Contains Alpha Olefin Market Size By Application (Polyethylene, Detergent Alcohol, Synthetic Lubricant), By Product (1-Butene, 1-Hexene, 1-Octene), Competitive Analysis & Forecast, 2012 - 2020 Industry Overview Global alpha olefin market size is expected to reach 5.16 million tons by 2020, growing at a CAGR of 4.4% from 2014 to 2020. Polyethylene is expected to witness a surge in demand on account of its easy processability, versatility, recyclability, and low cost. Increase in polyethylene demand for plastic production is expected to drive alpha olefin market growth. These olefins are primarily used as feedstock for manufacturing LLDPE and HDPE. Strong packaged food products demand, particularly in Asia Pacific, is expected to drive LLDPE market. Global polyethylene demand was 81,914.88 kilo tons in 2013 and is expected to exceed 106,742.46 kilo tons by 2020, at a growth rate of 4.0%. Polyethylene market growth is expected to be fuelled by world economic growth. Increasing population coupled with polyethylene’s application versatility is further expected to drive the polyethylene market over the forecast period. Growing protective films usage in agriculture to reduce soil erosion and increase protection against UV rays is also anticipated to fuel demand. Growing poly-alpha-olefin demand for synthetic lubricants in order to reduce engine wear & tear is expected to drive market growth. Increasing oilfield exploration & drilling activities is anticipated to drive demand. It is being developed as synthetic based oil drilling fluid which is likely to help address environmental concerns associated with diesel based oil based mud. Volatile prices of key raw materials such as ethylene are likely to affect the profitability of industry participants. Increasing government regulations regarding polyethylene usage coupled with release of green house gases (GNG) is likely to challenge industry. Investments in research to develop bio-based alpha olefin are likely to reduce dependability on petrochemical based raw materials and curb GNG.North America alpha olefin market size, by application, 2012-2020 (Kilo Tons)Product Overview 1-hexene was the dominant product segment in alpha olefins market and was valued at over USD 1.8 billion in 2013. 1-hexene is also likely to witness highest gains over the forecast period owing to its increasing use as a co monomer for manufacturing LLDPE and HDPE polymers. 1-octene accounted for more than 21% of the total demand in 2013 and is anticipated to witness moderate growth rates of CAGR over 4.1% up to 2020. Growth of application segments such as plasticizers, cosmetics and adhesives is likely to drive 1-octene demand. Application Overview Polyethylene application witnessed the highest alpha olefin consumption over the past few years and witnessed a revenue generation of over USD 4.3 billion in 2013. This application is expected to witness significant growth rates over the next six years. Increasing demand from automotive, packaging and consumer goods industry owing to increasing population is expected to drive market growth. Detergent alcohol applications were the second largest and accounted for more than 10% of the total volume in 2013. This application is anticipated to witness moderate gains at CAGR over 3.2% up to 2020. Growth of detergent and personal care industry is expected to drive alpha olefin demand for detergent alcohol. Regional Overview North America alpha olefin market was the leading region with an estimated revenue generation of over USD 3.3 billion in 2013. Growth of oilfield drilling activities in U.S. coupled with capacity expansion of key industry participants in the region is expected to drive the regional growth. Increasing oil exploration along Gulf of Mexico is anticipated to further drive regional demand. Asia Pacific alpha olefin market demand is expected to exceed 900 kilotons by 2020, while Europe is expected to witness annual gains of 2.6% up to 2020. Competitive Market Share The global alpha olefin market share is moderately concentrated with top four companies accounting for over 60% of the total demand in 2013. Key market players are concentrated within the U.S. and Middle East regions due to easy and ample availability of petrochemical products and NGLs in these regions. Shell Chemicals Ltd. was the leading alpha olefins producer and accounted for over 25% of the market share in 2013. Other Key companies include Chevron Philips, Sasol, Nizhnekamskneftekhim, Ineos Oligomers, Evonik, ExxonMobil, Linde AG, Saudi Basic Industries Corp, Mitsubishi Chemical and Qatar chemical.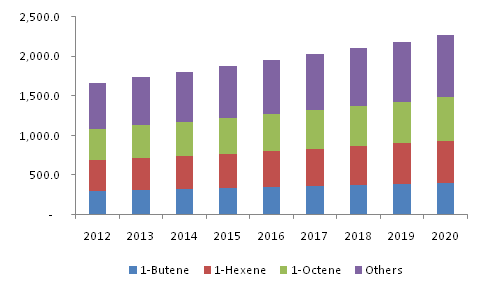
 Table of Content

Chapter 1	Executive Summary

Chapter 2	Alpha Olefins Industry Overview
2.1	Market segmentation
2.2	Market size and growth prospects, 2012 - 2020
2.3	Alpha olefins value chain analysis
2.4	Alpha olefins market dynamics
2.4.1	Market driver analysis
2.4.1.1	Growing polyethylene demand
2.4.1.2	Easy availability of key raw materials
2.4.2	Market restraint analysis
2.4.2.1	Volatile raw material prices
2.5	Key opportunities prioritized
2.6	Industry analysis – Porter’s
2.7	Global alpha olefins company market share analysis, 2013
2.8	Alpha olefins – PESTEL analysis

Chapter 3	Alpha Olefins Product Overview
3.1	Global alpha olefins market volume share by product, 2013& 2020
3.2	1-Butene
3.2.1	Market estimates and forecast, 2012-2020 (Kio Tons) (USD Million)
3.2.2	Market estimates and forecast by region, 2012-2020 (Kio Tons) (USD Million)
3.2.3	Market estimates and forecast by application, 2012-2020 (Kio Tons) (USD Million)
3.3	1-Hexene
3.3.1	Market estimates and forecast, 2012-2020 (Kio Tons) (USD Million)
3.3.2	Market estimates and forecast by region, 2012 to 2020 (Kio Tons) (USD Million)
3.3.3	Market estimates and forecast by application, 2012 to 2020 (Kio Tons) (USD Million)
3.4	1-Octene
3.4.1	Market estimates and forecast, 2012-2020 (Kio Tons) (USD Million)
3.4.2	Market estimates and forecast by region, 2012 to 2020 (Kio Tons) (USD Million)
3.4.3	Market estimates and forecast by application, 2012 to 2020 (Kio Tons) (USD Million)
3.5	Others
3.5.1	Market estimates and forecast, 2012-2020 (Kio Tons) (USD Million)
3.5.2	Market estimates and forecast from by region, 2012-2020 (Kio Tons) (USD Million)
3.5.3	Market estimates and forecast by application, 2012 to 2020 (Kio Tons) (USD Million)

Chapter 4	Alpha Olefins Application Overview
4.1	Global alpha olefins market volume share by application, 2013 & 2020
4.2	Polyethylene
4.2.1	Market estimates and forecast, 2012-2020 (Kio Tons) (USD Million)
4.2.2	Market estimates and forecast in polyethylene by region, 2012-2020 (Kio Tons) (USD Million)
4.2.3	Market estimates and forecast by PE by product, 2012-2020
		4.2.3.1	 Linear Low Density Polyethylene (LLDPE)
		4.2.3.1.1	Market estimates and forecast, 2012-2020 (Kio Tons) (USD Million)
4.2.3.1	 High Density Polyethylene (HDPE)
		4.2.3.1.1	Market estimates and forecast, 2012-2020 (Kio Tons) (USD Million)
4.3	Detergent alcohol
4.3.1	Market estimates and forecast in detergent alcohol, 2012-2020 (Kio Tons) (USD Million)
4.3.2	Market estimates and forecast by region, 2012-2020 (Kio Tons) (USD Million)
4.4	Synthetic lubricant
4.4.1	Market estimates and forecast, 2012-2020 (Kio Tons) (USD Million)
4.4.2	Market estimates and forecast i by region, 2012-2020 (Kio Tons) (USD Million)
4.5	Other
4.5.1	Market estimates and forecast, 2012-2020 (Kio Tons) (USD Million)
4.5.2	Market estimates and forecast by region, 2012-2020 (Kio Tons) (USD Million)

Chapter 5	Alpha Olefins Regional Overview
5.1	Global alpha olefins market volume share by region, 2013 & 2020
5.2	North America
5.2.1	Market estimates and forecast, 2012 – 2020 (Kio Tons) (USD Million)
5.2.2	Market estimates and forecast, by product, 2012 – 2020 (Kio Tons) (USD Million)
5.2.3	Market estimates and forecast, by application, 2012 – 2020 (Kio Tons) (USD Million)
5.3	Europe
5.3.1	Market estimates and forecast, 2012 – 2020 (Kio Tons) (USD Million)
5.3.2	Market estimates and forecast, by product, 2012 – 2020 (Kio Tons) (USD Million)
5.3.3	Market estimates and forecast, by application, 2012 – 2020 (Kio Tons) (USD Million)
5.4	Asia Pacific
5.4.1	Market estimates and forecast, 2012 – 2020 (Kio Tons) (USD Million)
5.4.2	Market estimates and forecast, by product, 2012 – 2020 (Kio Tons) (USD Million)
5.4.3	Market estimates and forecast, by application, 2012 – 2020 (Kio Tons) (USD Million)
5.5	RoW
5.5.1	Market estimates and forecast, 2012 – 2020 (Kio Tons) (USD Million)
5.5.2	Market estimates and forecast, by product, 2012 – 2020 (Kio Tons) (USD Million)
5.5.3	Market estimates and forecast, by application, 2012 – 2020 (Kio Tons) (USD Million)

Chapter 6	Competitive Landscape
6.1	Chevron Phillips Chemical Company LLC
6.1.1	Company Overview
6.1.2	Financial Performance
6.1.3	Product Benchmarking
6.1.4	Strategic Initiatives
6.2	Dow Chemical Co.
6.2.1	Company Overview
6.2.2	Financial Performance
6.2.3	Product Benchmarking
6.2.4	Strategic Initiatives
6.3	ExxonMobil
6.3.1	Company Overview
6.3.2	Financial Performance
6.3.3	Product Benchmarking
6.3.4	Strategic Initiatives
6.4	Godrej Industries Limited
6.4.1	Company Overview
6.4.2	Financial Performance
6.4.3	Product Benchmarking
6.5	Idemitsu Petrochemical Co. Ltd.
6.5.1	Company Overview
6.5.2	Financial Performance
6.5.3	Product Benchmarking
6.5.4	Strategic Initiatives
6.6	INEOS Oligomers
6.6.1	Company Overview
6.6.2	Financial Performance
6.6.3	Product Benchmarking
6.6.4	Strategic Initiatives
6.7	Mitsubishi Chemical Corp.
6.7.1	Company Overview
6.7.2	Financial Performance
6.7.3	Product Benchmarking
6.7.4	Strategic Initiatives
6.8	Nizhnekamskneftekhim
6.8.1	Company Overview
6.8.2	Financial Performance
6.8.3	Product Benchmarking
6.8.4	Strategic Initiatives
6.9	Qatar Chemical Company Ltd (Q-Chem)
6.9.1	The Company Overview
6.9.2	Financial Performance
6.9.3	Product Benchmarking
6.9.4	Strategic Initiatives
6.10	Qatar Chemical Company II Ltd.
6.10.1	The Company Overview
6.10.2	Financial Performance
6.10.3	Product Benchmarking
6.10.4	Strategic Initiatives
6.11	Sasol Limited
6.11.1	Company Overview
6.11.2	Financial Performance
6.11.3	Product Benchmarking
6.11.4	Strategic Initiatives
6.12	Saudi Basic Industries Corporation (SABIC)
6.12.1	Company Overview
6.12.2	Financial Performance
6.12.3	Product Benchmarking
6.12.4	Strategic Initiatives
6.13	Royal Dutch Shell Plc.
6.13.1	Company Overview
6.13.2	Financial Performance
6.13.3	Product Benchmarking
6.13.4	Strategic Initiatives

Chapter 7	Methodology & Scope
7.1	Research Methodology
7.2	Research Scope & Assumptions
7.3	List of Data Sources
List of Tables

TABLE 1	Global Alpha Olefins – Industry Summary & Critical Success Factors (CSFs)
TABLE 2	Global alpha olefins market estimates and forecast, 2012 – 2020, (Kilo Tons) (USD Million)
TABLE 3	Global alpha olefins market volume by region, 2012 – 2020, (Kilo Tons)
TABLE 4	Global alpha olefins market revenue by region, 2012 – 2020, (USD Million)
TABLE 5	Global alpha olefins market volume by product, 2012 – 2020, (Kilo Tons)
TABLE 6	Global alpha olefins market revenue by product, 2012 – 2020, (USD Million)
TABLE 7	Global alpha olefins market volume by application, 2012 – 2020, (Kilo Tons)
TABLE 8	Global alpha olefins market revenue by application, 2012 – 2020, (USD Million)
TABLE 9	Global 1-butene market estimates and forecast, 2012-2020, (Kilo Tons) (USD Million)
TABLE 10	Global 1-butene market volume estimates and forecasts by region, 2012-2020, (Kilo Tons)
TABLE 11	Global 1-butene market revenue estimates and forecasts by region, 2012-2020, (USD Million)
TABLE 12	Global 1-butene market volume estimates and forecasts by application, 2012-2020, (Kilo Tons)
TABLE 13	Global 1-butene market revenue estimates and forecasts by application, 2012-2020, (USD Million)
TABLE 14	Global 1-hexene market estimates and forecast, 2012-2020, (Kilo Tons) (USD Million)
TABLE 15	Global 1-hexene market volume estimates and forecasts by region, 2012-2020, (Kilo Tons)
TABLE 16	Global 1-hexene market revenue estimates and forecasts by region, 2012-2020, (USD Million)
TABLE 17	Global 1-hexene market volume estimates and forecasts by application, 2012-2020, (Kilo Tons)
TABLE 18	Global 1-hexene market revenue estimates and forecasts by application, 2012-2020, (USD Million)
TABLE 19	Global 1-octene market estimates and forecast, 2012 to 2020, (Kilo Tons) (USD Million)
TABLE 20	Global 1-octene market volume estimates and forecasts by region, 2012-2020, (Kilo Tons)
TABLE 21	Global 1-octene market revenue estimates and forecasts by region, 2012-2020 (USD Million)
TABLE 22	Global 1-octene market volume estimates and forecasts by application, 2012-2020, (Kilo Tons)
TABLE 23	Global 1-octene market revenue estimates and forecasts by application, 2012-2020, (USD Million)
TABLE 24	Global other alpha olefins market estimates and forecast, 2012-2020, (Kilo Tons) (USD Million)
TABLE 25	Global other alpha olefins market volume estimates and forecasts by region, 2012-2020 (Kilo Tons)
TABLE 26	Global other alpha olefins market revenue estimates and by region, 2012-2020 (USD Million)
TABLE 27	Global other alpha olefins market volume estimates and forecasts by application, 2012-2020, (Kilo Tons)
TABLE 28	Global other alpha olefins market revenue estimates and forecasts by application, 2012-2020, (USD Million)
TABLE 29	Global alpha olefins market estimates and forecasts in polyethylene, 2012-2020, (Kilo Tons) (USD Million)
TABLE 30	Global alpha olefins market volume estimates and forecasts in polyethylene by product, 2012-2020, (Kilo Tons)
TABLE 31	Global alpha olefins market revenue estimates and forecasts in polyethylene by product, 2012-2020, (USD Million)
TABLE 32	Global alpha olefins market volume estimates and forecasts in polyethylene by region, 2012-2020, (Kilo Tons)
TABLE 33	Global alpha olefins market revenue estimates and forecasts in polyethylene by region, 2012-2020, (USD Million)
TABLE 34	Global polyethylene market volume estimates and forecasts by product, 2012-2020, (Kilo Tons)
TABLE 35	Global polyethylene market revenue estimates and forecasts by product, 2012-2020, (Kilo Tons)
TABLE 36	Global alpha olefins market estimates and forecast in detergent alcohol, 2012-2020, (Kilo Tons) (USD Million)
TABLE 37	Global alpha olefins market volume estimates and forecasts in detergent alcohol by product, 2012-2020, (Kilo Tons)
TABLE 38	Global alpha olefins market revenue estimates and forecasts in detergent alcohol by product, 2012-2020, (USD Million)
TABLE 39	Global alpha olefins market volume estimates and forecasts in detergent alcohol by region, 2012-2020, (Kilo Tons)
TABLE 40	Global alpha olefins market revenue estimates and forecasts in detergent alcohol by region, 2012-2020, (USD Million)
TABLE 41	Global alpha olefins market estimates and forecast in synthetic lubricant, 2012-2020, (Kilo Tons) (USD Million)
TABLE 42	Global alpha olefins market volume estimates and forecasts in synthetic lubricant by product, 2012-2020, (Kilo Tons)
TABLE 43	Global alpha olefins market revenue estimates and forecasts in synthetic lubricants by product, 2012-2020, (USD Million)
TABLE 44	Global alpha olefins market volume estimates and forecasts in synthetic lubricant by region, 2012-2020, (Kilo Tons)
TABLE 45	Global alpha olefins market revenue estimates and forecasts in synthetic lubricants by region, 2012-2020, (USD Million)
TABLE 46	Global alpha olefins market estimates and forecast from other applications, 2012-2020, (Kilo Tons) (USD Million)
TABLE 47	Global alpha olefins market volume estimates and forecasts in other applications by product, 2012-2020, (Kilo Tons)
TABLE 48	Global alpha olefins market revenue estimates and forecasts in other applications by product, 2012-2020, (USD Million)
TABLE 49	Global alpha olefins market volume estimates and forecasts in other applications by region, 2012-2020, (Kilo Tons)
TABLE 50	Global alpha olefins market revenue estimates and forecasts in other applications by region, 2012-2020, (USD Million)
TABLE 51	North America alpha olefins market estimates and forecast, 2012 – 2020, (Kilo Tons) (USD Million)
TABLE 52	North America alpha olefins market volume estimates and forecasts by product, 2012 – 2020, (Kilo Tons)
TABLE 53	North America alpha olefins market revenue estimates and forecasts by product, 2012 – 2020, (USD Million)
TABLE 54	North America alpha olefins market volume estimates and forecasts by application, 2012 – 2020, (Kilo Tons)
TABLE 55	North America alpha olefins market revenue estimates and forecasts by application, 2012 – 2020, (USD Million)
TABLE 56	Europe alpha olefins market estimates and forecast, 2012 – 2020, (Kilo Tons) (USD Million)
TABLE 57	Europe alpha olefins market volume estimates and forecasts by product, 2012 – 2020, (Kilo Tons)
TABLE 58	Europe alpha olefins market revenue estimates and forecasts by product, 2012 – 2020, (USD Million)
TABLE 59	Europe alpha olefins market volume estimates and forecasts by application, 2012 – 2020, (Kilo Tons)
TABLE 60	Europe alpha olefins market revenue estimates and forecasts by application, 2012 – 2020, (USD Million)
TABLE 61	Asia Pacific alpha olefins market estimates and forecast, 2012 – 2020, (Kilo Tons) (USD Million)
TABLE 62	Asia Pacific alpha olefins market volume estimates and forecasts by application, 2012 – 2020, (Kilo Tons)
TABLE 63	Asia Pacific alpha olefins market revenue estimates and forecasts by application, 2012 – 2020, (USD Million)
TABLE 64	Asia Pacific alpha olefins market volume estimates and forecasts by application, 2012 – 2020, (Kilo Tons)
TABLE 65	Asia Pacific alpha olefins market revenue estimates and forecasts by application, 2012 – 2020, (USD Million)
TABLE 66	RoW alpha olefins market estimates and forecast, 2012 – 2020, (Kilo Tons) (USD Million)
TABLE 67	RoW alpha olefins market volume estimates and forecasts by product, 2012 – 2020, (Kilo Tons)
TABLE 68	RoW alpha olefins market revenue estimates and forecasts by product, 2012 – 2020, (USD Million)
TABLE 69	RoW alpha olefins market volume estimates and forecasts by application, 2012 – 2020, (Kilo Tons)
TABLE 70	RoW alpha olefins market revenue estimates and forecasts by application, 2012 – 2020, (USD Million)

List of Figures

FIG. 1	Global alpha olefins market segmentation
FIG. 2	Global alpha olefins market estimates and forecast, 2012 – 2020, (Kilo Tons) (USD Million)
FIG. 3	Global alpha olefins value chain analysis
FIG. 4	Global alpha olefins market dynamics
FIG. 5	Polyethylene market estimates and forecast, 2010–2018 (Kilo Tons)
FIG. 6	Global ethylene production, 2008–2014 (Million Tons)
FIG. 7	Global crude oil production, 2012–2020, (Million Barrels/Day)
FIG. 8	The U.S. shale gas production, 2008–2013, (Billion Cubic Feet)
FIG. 9	Natural gas production by key countries, 2009–2013, (Billion Cubic Feet)
FIG. 10	Global ethylene and crude oil prices, 2010–2014 (USD per Ton), (USD per Barrel)
FIG. 11	Key opportunities prioritized
FIG. 12	Global alpha olefins Porter’s analysis
FIG. 13	Global alpha olefins company market share analysis, 2013
FIG. 14	Global alpha olefins PESTEL analysis
FIG. 15	Global alpha olefins market volume share by application, 2013 & 2020
FIG. 16	Global alpha olefins market volume share by application, 2013 & 2020
FIG. 17	Global alpha olefins market volume share by region, 2013 & 2020

Speak to the report author to design an exclusive study to serve your research needs.
Your personal and confidential information is safe and secure.

