Toll Free: 1-888-928-9744
Toll Free: 1-888-928-9744

Published: Oct, 2015 | Pages:
92 | Publisher: Radiant Insights Inc.
Industry: Plastics | Report Format: Electronic (PDF)
The Report Contains Aerospace Plastics Market Size By End User (Commercial & Freighter Aircrafts, Military Aircrafts, Rotary Aircrafts, General Aviation), By Application (Airframe & Fuselage, Wings & Rotor Blades, Empennage, Flight Deck & Cockpit, Cabin Areas) Competitive Analysis & Forecast, 2012 - 2020 Industry Overview Global aerospace plastics market size is expected to reach 112.5 kilo tons by 2020, growing at a CAGR of 12.0% from 2014 to 2020. Increasing lightweight materials demand for aerospace applications coupled with aviation industry growth is expected to drive aerospace plastics market over the forecast period. They are widely preferred due to their excellent corrosion resistance property, thereby elongating the shelf life of aircrafts. Aerospace components that comprise of carbon fibers are flexible and resistant to damage. Global commercial and general aviation aircraft production was 3,579 units in 2013 and is expected to reach over 5,000 units by 2020. The rising demand in commercial and general aviation is due to growing industrialization and globalization that has given a major thrust to the aviation industry. This is expected to generate substantial demand and enhance revenue. In addition, the growth of low cost carriers in developing economies is anticipated to surge aircraft demand thereby driving market growth. Currently, the percentage of plastics utilized in manufacturing the Boeing 787 accounts for more than 50% of its overall weight. Components with complex curved structures are easily manufactured using aerospace plastics. Such complex curved structures improve the aerodynamics and reduce drag, which enhances the fuel efficiency. High quality carbon fiber reinforced plastics (CFRP) material exhibits electromagnetic transparency, which enables military aircrafts to survey areas without getting tracked by the radar. Vendors of the global aerospace plastics market are expected to earn benefits due to increased usage of composites in new-generation aircrafts. Utilization of these lighter and stronger materials has significantly grown over the past decade, leading to greater fuel efficiency and lower costs for the airline industry. CFRPs are currently one of the strongest and lightest materials available in the market. Lightweight polymers also increase flight time of remote controlled surveillance aircrafts as these aircrafts are not burdened with human pilots, the fuel burnt is directly proportional to the weight of the aircraft. Toxicity issues associated with composites such as CRPs are expected to hamper industry growth. Production of carbon fiber emits substantial greenhouse gases in the atmosphere that are harmful to human health. High fabrication costs coupled with safety issues is also anticipated to challenge industry growth. It involves a complex and labor intensive process, thereby increasing manufacturing costs. The polymers manufactured are difficult for flaw detection which can result in defects & quality variation and thereby can lead to fracture and material failure coupled with high maintenance.North America aerospace plastics market, by application, 2012-2020 (Tons)Application Overview Airframe & fuselage construction was the largest aerospace plastic market application and was valued over USD 2 billion in 2013. This application is anticipated to witness high growth rates over the forecast period. Aircraft frame contains the maximum amount of CFRP and composites which makes airframes lighter by as much as 20% as compared to conventional aluminum designs. The extended use of composites in high tension loaded environment of the fuselage reduces the maintenance primarily due to fatigue. Cabin areas witnessed the second largest consumption by accounting for over 23% of the total demand in 2013. This application is anticipated to grow at above average growth rates with an estimated CAGR of over 12% from 2014 to 2020. The seats in cabin areas of an aircraft include a wide range of moldings for products such as trim strips, decorative closeouts, arm rests, and food trays. ABS (Acrylonitrile Butadiene Styrene), polycarbonate, and decorative vinyl are materials that are mostly used for these purposes. End Use Overview Commercial & freighter aircrafts were the largest end-user segments with an estimated revenue generation of over USD 5.5 billion in 2013. The need for fuel efficiency and reduced maintenance costs has shifted the paradigm of the commercial aircrafts from aluminum to aerospace polymers. Military aircrafts are likely to witness highest gains at CAGR over 13% from 2014 to 2020. These materials are used for completing assemblies for heads-up-displays, firearms, night vision systems, and other military and aerospace applications. The manufacturers have been increasingly using polymers in the integrated circuits of military aircrafts since these integrated circuits are able to operate even in high temperatures. Regional Overview Europe aerospace plastics market was the leading regional industry with an estimated revenue generation of over USD 3.3 billion in 2013. Availability of skilled engineers and glut of investments is seen in research & development in Europe. Presence of foreign companies in France which include European consortiums along with French participants (ATR, EADS, etc.) has significantly bolstered the European market. Due to excessive demand in U.K. and other European regions, particularly in Germany and France, the European aerospace plastic market is expected to witness significant growth. North America was the second largest regional market accounting for a share of more than 35% in terms of demand. The U.S. was traditionally viewed as one of the prominent centers of the global commercial aircraft market. The North American airline industry witnessed a growth of 2% in the past three years in terms of traffic and capacity. Higher purchase plans were found in the major U.S. centers, which impacted the aerospace plastics demand profoundly. Strong military developments mainly in the U.S. have assisted the market evolve even during the economic slowdown. Competitive Market Share The global aerospace plastics market share was significantly concentrated with the top four companies accounting for over 70% of the market share in 2013. Toray was the market leader in the segment with a market share of over 27% in 2013. Toray is one of the leading suppliers of advanced composite materials to major aerospace product manufacturers that include Boeing and Airbus. Prominent companies involved in this market include Cytec Industries Inc., Composite Holding Company, Hexcel Corporation, Ensinger GmbH, Hyosung Corporation, HITCO Carbon Composites Inc., Mitsubishi Heavy Industries Limited and Kaman Corporation. Other key manufactures include Saudi Basic Industries Corporation, Premium Aerotec, Tech-Tool, Zoltek Companies Incorporated and Toho Tenax Company Limited.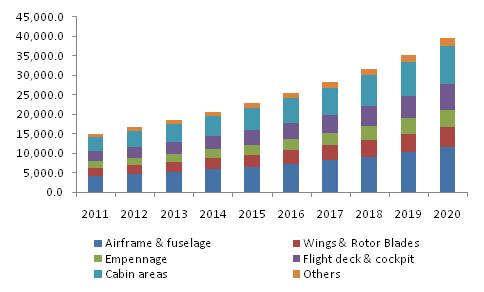
 Table of Content

Chapter 1	Executive Summary

Chapter 2	Aerospace Plastics Industry Overview
2.1	Market segmentation
2.2	Market Size and Growth Prospects
2.3	Aerospace Plastics - Value Chain Analysis
2.4	Aerospace Plastics – Market dynamics
2.4.1	Market Driver Analysis
2.4.1.1	Development of the aviation industry
2.4.1.2	Substitute to aluminum and steel
2.4.1.3	Easy adoption in aircraft design
2.4.2	Market Restraints Analysis
2.4.2.1	Toxicity issues
2.4.2.2	High fabrication costs
2.4.2.3	Safety Issues
2.5	Key opportunities - Prioritized
2.6	Aerospace Plastics Company Market Share Analysis, 2013
2.7	Industry Analysis – Porter’s
2.8	Aerospace Plastics – PESTEL Analysis

Chapter 3	Aerospace Plastics Application Overview
3.1	Aerospace plastics volume share by application, 2013 & 2020
3.2	Airframe & Fuselage
3.2.1	Market estimates and forecast, 2012-2020, (Tons) (USD Million)
3.2.2	Market estimates and forecast, by region, 2012-2020, (Tons) (USD Million)
3.3	Wings and Rotor Blades
3.3.1	Market estimates and forecast, 2012-2020, (Tons) (USD Million)
3.3.2	Market estimates and forecast, by region, 2012-2020, (Tons) (USD Million)
3.4	Empennage
3.4.1	Market estimates and forecast, 2012-2020, (Tons) (USD Million)
3.4.2	Market estimates and forecast, by region, 2012-2020, (Tons) (USD Million)
3.5	Flight Deck & Cockpit
3.5.1	Market estimates and forecast, 2012-2020, (Tons) (USD Million)
3.5.2	Market estimates and forecast, by region, 2012-2020, (Tons) (USD Million)
3.6	Cabin Areas
3.6.1	Market estimates and forecast, 2012-2020, (Tons) (USD Million)
3.6.2	Market estimates and forecast, by region, 2012-2020, (Tons) (USD Million)
3.7	Others
3.7.1	Market estimates and forecast, 2012-2020, (Tons) (USD Million)
3.7.2	Market estimates and forecast, by region, 2012-2020, (Tons) (USD Million)

Chapter 4	Aerospace Plastics End-Use Overview
4.1	Aerospace plastics volume share by end-use, 2013 & 2020
4.2	Commercial and Freighter Aircrafts
4.2.1	Market estimates and forecast, 2012-2020, (Tons) (USD Million)
4.2.2	Market estimates and forecast by region, 2012-2020, (Tons) (USD Million)
4.3	Military Aircrafts
4.3.1	Market estimates and forecast, 2012-2020, (Tons) (USD Million)
4.3.2	Market estimates and forecast by region, 2012-2020, (Tons) (USD Million)
4.4	Rotary Aircrafts
4.4.1	Market estimates and forecast, 2012-2020, (Tons) (USD Million)
4.4.2	Market estimates and forecast by region, 2012-2020, (Tons) (USD Million)
4.5	General Aviation
4.5.1	Market estimates and forecast, 2012-2020, (Tons) (USD Million)
4.5.2	Market estimates and forecast by region, 2012-2020, (Tons) (USD Million)

Chapter 5	Aerospace Plastics Regional Overview
5.1	Aerospace plastics market volume share by region, 2013 & 2020
5.2	North America
5.2.1	Market estimates and forecast, 2012-2020, (Tons) (USD Million)
5.2.2	No Market estimates and forecast by application, 2012 – 2020, (Tons) (USD Million)
5.2.3	Market estimates and forecast by end-use, 2012 – 2020, (Tons) (USD Million)
5.3	Europe
5.3.1	Market estimates and forecast 2012-2020, (Tons) (USD Million)
5.3.2	Market estimates and forecast by application, 2012 – 2020, (Tons) (USD Million)
5.3.3	Market estimates and forecast by end-use, 2012 – 2020, (Tons) (USD Million)
5.4	Asia Pacific
5.4.1	Market estimates and forecast 2012-2020, (Tons) (USD Million)
5.4.2	Market estimates and forecast by application, 2012 – 2020, (Tons) (USD Million)
5.4.3	Market estimates and forecast by end-use, 2012 – 2020, (Tons) (USD Million)
5.5	RoW
5.5.1	Market estimates and forecast 2012-2020, (Tons) (USD Million)
5.5.2	Market estimates and forecast by application, 2012 – 2020, (Tons) (USD Million)
5.5.3	Market estimates and forecast by end-use, 2012 – 2020, (Tons) (USD Million)

Chapter 6	Competitive Landscape
6.1	Hyosung Corporation
6.1.1	Company Overview
6.1.2	Financial Performance
6.1.3	Product Benchmarking
6.1.4	Strategic Initiatives
6.2	Kaman Aerospace Corporation
6.2.1	Financial Performance
6.2.2	Product Benchmarking
6.2.3	Strategic Initiatives
6.3	Mitsubishi Heavy Industries Ltd.
6.3.1	Company Overview
6.3.2	Financial Performance
6.3.3	Product Benchmarking
6.3.4	Strategic Initiatives
6.4	Premium Aerotec GmbH
6.4.1	Company Overview
6.4.2	Financial Performance
6.4.3	Product Benchmarking
6.4.4	Strategic Initiatives
6.8	Toho Tenax Co. Ltd.
6.8.1	Company Overview
6.8.2	Financial Performance
6.8.3	Product Benchmarking
6.8.4	Strategic Initiatives
6.9	Toray Carbon Fibers America Inc.
6.9.1	Company Overview
6.9.2	Financial Performance
6.9.3	Product Benchmarking
6.11	BASF SE
6.11.1	Company Overview
6.11.2	Financial Performance
6.11.3	Product Benchmarking
6.11.4	Strategic Initiatives
6.12	Evonik Industries AG
6.12.1	Company Overview
6.12.2	Financial Performance
6.12.3	Product Benchmarking
6.12.4	Strategic Initiatives
6.13	Holding Company Composite
6.13.1	Company Overview
6.13.2	Financial Performance
6.13.3	Product Benchmarking
6.13.4	Strategic Initiatives
6.14	Cytec Industries Inc.
6.14.1	Company Overview
6.14.2	Financial Performance
6.14.3	Product Benchmarking
6.14.4	Strategic Initiatives
6.15	Ensinger GmbH.
6.15.1	Company Overview
6.15.2	Financial Performance
6.15.3	Product Benchmarking
6.15.4	Strategic Initiatives
6.16	Hexcel Corporation.
6.16.1	Company Overview
6.16.2	Financial Performance
6.16.3	Product Benchmarking
6.16.4	Strategic Initiatives
6.17	HITCO Carbon Composites, Inc
6.17.1	Company Overview
6.17.2	Financial Performance
6.17.3	Product Benchmarking
6.17.4	Strategic Initiatives
6.18	Solvay S.A.
6.18.1	Company Overview
6.18.2	Financial Performance
6.18.3	Strategic Initiatives
6.18.4	Product Benchmarking

Chapter 7	Methodology and Scope
7.1	Research Methodology
7.2	Research Scope & Assumptions
7.3	List of Data Sources
List of Tables

TABLE 1	Aerospace Plastics – Industry Summary & Critical Success Factors (CSFs)
TABLE 2	Global aerospace plastics market, (volume and revenue), 2012 - 2020
TABLE 3	Global aerospace plastics market volume by region, (Tons), 2012 - 2020
TABLE 4	Global aerospace plastics market revenue by region, (USD Million), 2012 - 2020
TABLE 5	Global aerospace plastics market volume by application, (Tons), 2012 - 2020
TABLE 6	Global aerospace plastics market revenue by application, (USD Million), 2012 - 2020
TABLE 7	Global aerospace plastics market volume by end-use, (Tons), 2012 - 2020
TABLE 8	Global aerospace plastics market revenue by end-use, (USD Million), 2012 - 2020
TABLE 9	Aerospace – Key market driver analysis
TABLE 10	Weight reduced with CFRP usage comparative to aluminum
TABLE 11	Aerospace plastics – Key market restraint analysis
TABLE 12	Greenhouse gas emissions by different aerospace materials
TABLE 13	Global aerospace plastics market estimates and forecast in airframe and fuselage, 2012-2020, (Tons) (USD Million)
TABLE 14	Global aerospace plastics market volume in airframe and fuselage, by region, 2012-2020, (Tons)
TABLE 15	Global aerospace plastics market revenue in airframe and fuselage, by region, 2012-2020, (USD Million)
TABLE 16	Global aerospace plastics market estimates and forecast in wings and rotor blades, 2012-2020, (Tons) (USD Million)
TABLE 17	Global aerospace plastics market volume in wings and rotor blades, by region, 2012-2020, (Tons)
TABLE 18	Global aerospace plastics market revenue in wings and rotor blades, by region, 2012-2020, (USD Million)
TABLE 19	Global aerospace plastics market estimates and forecast in empennage, 2012-2020, (Tons) (USD Million)
TABLE 20	Global aerospace plastics market volume in empennage, by region, 2012-2020, (Tons)
TABLE 21	Global aerospace plastics market revenue in empennage, by region, 2012-2020, (USD Million)
TABLE 22	Global aerospace plastics market estimates and forecast in flight deck and cockpit, 2012-2020, (Tons) (USD Million)
TABLE 23	Global aerospace plastics market volume in flight deck and cockpit, by region, 2012-2020, (Tons)
TABLE 24	Global aerospace plastics market revenue in flight deck and cockpit, by region, 2012-2020, (USD Million)
TABLE 25	Global aerospace plastics market estimates and forecast in cabin areas, 2012-2020, (Tons) (USD Million)
TABLE 26	Global aerospace plastics market volume in cabin areas, by region, 2012-2020, (Tons)
TABLE 27	Global aerospace plastics market revenue in cabin areas, by region, 2012-2020, (USD Million)
TABLE 28	Global aerospace plastics market estimates and forecast in other applications, 2012-2020, (Tons) (USD Million)
TABLE 29	Global aerospace plastics market volume in other applications, by region, 2012-2020, (Tons)
TABLE 30	Global aerospace plastics market revenue in other applications, by region, 2012-2020, (USD Million)
TABLE 31	Global aerospace plastics market estimates and forecast in commercial and freighter aircrafts, 2012-2020, (Tons) (USD Million)
TABLE 32	Global aerospace plastics market volume in commercial and freighter aircrafts, by region, 2012-2020, (Tons)
TABLE 33	Global aerospace plastics market revenue in commercial and freighter aircrafts, by region, 2012-2020, (USD Million)
TABLE 34	Global aerospace plastics market estimates and forecast in military aircrafts, 2012-2020, (Tons) (USD Million)
TABLE 35	Global aerospace plastics market volume in military aircrafts, by region, 2012-2020, (Tons)
TABLE 36	Global aerospace plastics market revenue in military aircrafts, by region, 2012-2020, (USD Million)
TABLE 37	Global aerospace plastics market estimates and forecast in rotary aircrafts, 2012-2020, (Tons) (USD Million)
TABLE 38	Global aerospace plastics market volume in rotary aircrafts, by region, 2012-2020, (Tons)
TABLE 39	Global aerospace plastics market revenue in rotary aircrafts, by region, 2012-2020, (USD Million)
TABLE 40	Global aerospace plastics market estimates and forecast in general aviation, 2012-2020, (Tons) (USD Million)
TABLE 41	Global aerospace plastics market volume in general aviation, by region, 2012-2020, (Tons)
TABLE 42	Global aerospace plastics market revenue in general aviation, by region, 2012-2020, (USD Million)
TABLE 43	North America aerospace plastics market volume and revenue, 2012 – 2020, (Tons) (USD Million)
TABLE 44	North America aerospace plastics market volume, by application, 2012 –  2020, (Tons)
TABLE 45	North America aerospace plastics market revenue, by application, 2012 –  2020, (USD Million)
TABLE 46	North America aerospace plastics market volume, by end-use, 2012 – 2020, (Tons)
TABLE 47	North America aerospace plastics market revenue, by end-use, 2012 – 2020, (USD Million)
TABLE 48	Europe aerospace plastics market volume and revenue, 2012 – 2020, (Tons) (USD Million)
TABLE 49	Europe aerospace plastics market volume, by application, 2012 –  2020, (Tons)
TABLE 50	Europe aerospace plastics market revenue, by application, 2012 –  2020, (USD Million)
TABLE 51	Europe aerospace plastics market volume, by end-use, 2012 – 2020, (Tons)
TABLE 52	Europe aerospace plastics market revenue, by end-use, 2012 – 2020, (USD Million)
TABLE 53	Asia Pacific aerospace plastics market volume and revenue, 2012 – 2020, (Tons) (USD Million)
TABLE 54	Asia Pacific aerospace plastics market volume, by application, 2012 –  2020, (Tons)
TABLE 55	Asia Pacific aerospace plastics market revenue, by application, 2012 –  2020, (USD Million)
TABLE 56	Asia Pacific aerospace plastics market volume, by end-use, 2012 – 2020, (Tons)
TABLE 57	Asia Pacific aerospace plastics market revenue, by end-use, 2012 – 2020, (USD Million)
TABLE 58	RoW aerospace plastics market volume and revenue, 2012 – 2020, (Tons) (USD Million)
TABLE 59	RoW aerospace plastics market volume, by application, 2012 –  2020, (Tons)
TABLE 60	RoW aerospace plastics market revenue, by application, 2012 –  2020, (USD Million)
TABLE 61	RoW aerospace plastics market volume, by end-use, 2012 – 2020, (Tons)
TABLE 62	RoW aerospace plastics market revenue, by end-use, 2012 – 2020, (USD Million)

List of Figures

FIG. 1	Aerospace plastics market segmentation
FIG. 2	Global Aerospace Plastics Market Revenue, 2012 - 2020
FIG. 3	Aerospace Plastics - Value Chain Analysis
FIG. 4	Aerospace Plastics Market Dynamics
FIG. 5	Global commercial and general aviation aircraft production, 2012 - 2020 (Units)
FIG. 6	Key Opportunities Prioritized
FIG. 7	Aerospace Plastics Company Market Share Analysis, 2013
FIG. 8	Aerospace Plastics – Porter’s Analysis
FIG. 9	Aerospace Plastics – PESTEL Analysis
FIG. 10	Aerospace plastics volume share by application, 2013 & 2020
FIG. 11	Aerospace plastics volume share by end-use, 2013 & 2020
FIG. 12	Aerospace plastics market volume share by region, 2013 & 2020

Speak to the report author to design an exclusive study to serve your research needs.
Your personal and confidential information is safe and secure.

