Toll Free: 1-888-928-9744
Toll Free: 1-888-928-9744

Published: Oct, 2015 | Pages:
137 | Publisher: Radiant Insights Inc.
Industry: Semiconductors | Report Format: Electronic (PDF)
The Report Contains Fingerprint Access Control Systems Market Analysis By Application (Consumer Electronics, Banking & Finance, Commercial, Government, Healthcare, Military & Defence), By Product (Capacitive, Pressure, Thermal Optical, Ultrasonic) Competitive Analysis & Forecasts To 2022 Industry Overview Global fingerprint access control systems market size is expected to reach USD 4.4 billion by 2022, growing at a CAGR of over 7% from 2015 to 2022. Escalating safety and security threats is anticipated to drive industry growth. Fingerprint authentication offers a reliable solution to enhance access control thus, assists to mitigate security breaches as well as transaction frauds. The global smartphone industry was valued at USD 2.5 billion in 2013. It is expected to reach USD 4.4 billion by 2022, growing at a CAGR of 7% over the coming years. Emergence of multi-functional and cost-effective smartphones is expected to fuel growth. Huge demand from Asia Pacific is estimated to drive fingerprint access control systems market demand. Highly competitive business environment is likely to boost confidentiality needs for organizational data and information. Biometric systems market is anticipated to witness significant growth owing to incapability of password and security PINs to safeguard the data. This safety equipment is increasingly implemented for home fortification. Government around the globe is now taking stringent initiatives for biometric enrolment of their citizens. Advent of projects such as national identification programs, e-passports and border control are expected to drive industry growth. This measure can be attributed to secure borders, prosecute criminals, verify immigration or employment and combat identity fraud or terrorism Implementation of this system requires huge capital investment. Apart from installation cost, it also involves allied expenses such as enrolling users, administering the system and training expenditures. However, theft or misuse of data is likely to pose a serious risk to the individual’s security. Fingerprint access control system market is expanding its roots into commercial, government as well as healthcare sectors. Its high penetration rate is projected to pose potential opportunities to the industry demand.North America fingerprint access control systems market size, by product, 2012-2022 (USD million)Product Overview Capacitive products accounted for over 27% of the overall industry share in 2014. It is anticipated to exceed over USD 1.3 billion by 2022 owing to its low cost as well as compact size. Optical products were valued over USD 900 million in 2014. It is estimated to grow at a CAGR of over 7% from 2015 to 2022. The growth can be attributed to high image quality robust long life of the system. Application Overview Commercial application was the leading segment, valued over USD 850 million in 2014. It is expected to exceed USD 1.4 billion by 2022, growing at a CAGR of 6.5% over the forecast period. The surge can be addressed to rising safety as well as security demands in various organizations. Consumer electronics accounted for over 4.5% of the overall market share. The growth can be accredited to rapid growing need for access control features in tablets & smartphones. Regional Overview North America fingerprint access control systems market was sized over USD 850 million in 2014. It is projected to accumulate more than 30% of the overall industry share by 2022. Regional growth can be attributed to flourishing biometric application in healthcare as well as consumer electronics industries. Asia Pacific fingerprint access control systems market is expected to witness considerable growth owing to increasing government initiatives in the region. It is likely to grow at a CAGR of over 7.5% from 2015 to 2022. Competitive Market Share The global fingerprint access control systems market share is highly consolidated by top three companies. 3M Cogent, Safran Group and NEC Corporation are estimated to account for more than 70% of the overall industry share in U.S. Other key players in U.S industry include Suprema, HID Global (Assa Abloy), Cross Match, Fingerprint Cards (FPC), Aware Inc, SecuGen, Daon Inc and Anviz Global among others.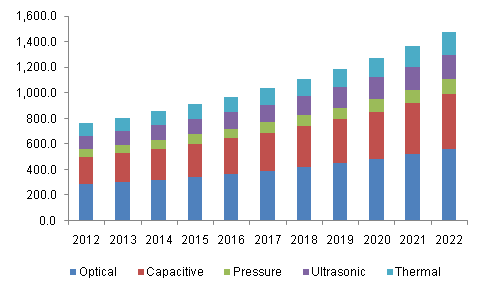
 Table of Contents

Chapter 1	Methodology and Scope
1.1	Research methodology
1.2	Research scope and assumptions
1.3	List of data sources

Chapter 2	Executive Summary
2.1	Fingerprint access control - Industry summary and key buying criteria, 2012 - 2022

Chapter 3	Fingerprint Access Control Industry Overview
3.1	Market segmentation
3.2	Market size and growth prospects
3.3	Fingerprint access control value chain analysis
3.3.1	Vendor landscape
3.4	Fingerprint access control market dynamics
3.4.1	Market driver analysis
3.4.1.1	Rising security concerns
3.4.1.2	Favorable regulatory scenario
3.4.1.3	Increasing smartphones demand
3.4.2	Market restraint analysis
3.4.2.1	High technology cost
3.4.2.2	Data security and privacy issues
3.5	Key opportunities - Prioritized
3.6	Industry analysis - Porter’s
3.7	Fingerprint access control – Key company analysis, 2014
3.7.1	Company strategy overview
3.8	Fingerprint access control PESTEL analysis

Chapter 4	Fingerprint Access Control Product Overview
4.1	Fingerprint access control market share by product, 2014 & 2022
4.2	Optical
4.2.1	Global optical sensing demand by region, 2012 – 2022
4.3	Capacitive
4.3.1	Global capacitive sensing demand by region, 2012 – 2022
4.4	Pressure
4.4.1	Global pressure sensing demand by region, 2012 – 2022
4.5	Ultrasonic
4.5.1	Global ultrasonic sensing demand by region, 2012 – 2022
4.6	Thermal
4.6.1	Global thermal sensing demand by region, 2012 – 2022

Chapter 5	Fingerprint Access Control Application Overview
5.1	Fingerprint access control market share by application, 2014 & 2022
5.2	Commercial
5.2.1	Global demand in commercial application by region, 2012 – 2022
5.3	Consumer Electronics
5.3.1	Global demand in consumer electronics by region, 2012 – 2022
5.4	Government
5.4.1	Global demand in government application by region, 2012 – 2022
5.5	Military & Defense
5.5.1	Global demand in military & defense by region, 2012 – 2022
5.6	Banking & Finance
5.6.1	Global demand in banking & finance by region, 2012 – 2022
5.7	Healthcare
5.7.1	Global demand in healthcare by region, 2012 – 2022
5.8	Others
5.8.1	Global demand in other applications by region, 2012 – 2022

Chapter 6	Fingerprint Access Control Regional Overview
6.1	Fingerprint access control market share by region, 2014 & 2022
6.2	North America
6.2.1	North America market by product, 2012 – 2022
6.2.2	North America market by application, 2012 – 2022
6.2.3	U.S.
6.2.3.1	U.S. market by product, 2012 – 2022
6.2.3.2	U.S. market by application, 2012 – 2022
6.2.4	Canada
6.2.4.1	Canada market by product, 2012 – 2022
6.2.4.2	Canada market by application, 2012 – 2022
6.3	Europe
6.3.1	Europe market by product, 2012 – 2022
6.3.2	Europe market by application, 2012 – 2022
6.3.3	Germany
6.3.3.1	Germany market by product, 2012 – 2022
6.3.3.2	Germany market by application, 2012 – 2022
6.3.4	UK
6.3.4.1	UK market by product, 2012 – 2022
6.3.4.2	UK market by application, 2012 – 2022
6.4	Asia Pacific
6.4.1	Asia Pacific market by product, 2012 – 2022
6.4.2	Asia Pacific market by application, 2012 – 2022
6.4.3	China
6.4.3.1	China market by product, 2012 – 2022
6.4.3.2	China market by application, 2012 – 2022
6.4.4	India
6.4.4.1	India market by product, 2012 – 2022
6.4.4.2	India market by application, 2012 – 2022
6.4.5	Japan
6.4.5.1	Japan market by product, 2012 – 2022
6.4.5.2	Japan market by application, 2012 – 2022
6.5	Latin America
6.5.1	Latin America market by product, 2012 – 2022
6.5.2	Latin America market by application, 2012 – 2022
6.5.3	Brazil
6.5.3.1	Brazil market by product, 2012 – 2022
6.5.3.2	Brazil market by application, 2012 – 2022
6.5.4	Mexico
6.5.4.1	Mexico market by product, 2012 – 2022
6.5.4.2	Mexico market by application, 2012 – 2022
6.6	MEA
6.6.1	MEA market by product, 2012 – 2022
6.6.2	MEA market by application, 2012 – 2022

Chapter 7	Competitive Landscape
7.1	Anviz Global
7.1.1	Company Overview
7.1.2	Financial Performance
7.1.3	Product Benchmarking
7.1.4	Strategic Initiatives
7.2	Aware, Inc.
7.2.1	Company Overview
7.2.2	Financial Performance
7.2.3	Product Benchmarking
7.2.4	Strategic Initiatives
7.3	3M Cogent
7.3.1	Company Overview
7.3.2	Financial Performance
7.3.3	Product Benchmarking
7.3.4	Strategic Initiatives
7.4	Cross Match Technology
7.4.1	Company Overview
7.4.2	Financial Performance
7.4.3	Product Benchmarking
7.4.4	Strategic Initiatives
7.5	Daon Inc.
7.5.1	Company Overview
7.5.2	Financial Performance
7.5.3	Product Benchmarking
7.5.4	Strategic Initiatives
7.6	Diamond Fortress Technologies
7.6.1	Company Overview
7.6.2	Financial Performance
7.6.3	Product Benchmarking
7.6.4	Strategic Initiatives
7.7	EnterTech Systems
7.7.1	Company Overview
7.7.2	Financial Performance
7.7.3	Product Benchmarking
7.7.4	Strategic Initiatives
7.8	Fingerprint Cards AB (FPC)
7.8.1	Company Overview
7.8.2	Financial Performance
7.8.3	Product Benchmarking
7.8.4	Strategic Initiatives
7.9	Hitachi-Omron Terminal Solutions
7.9.1	Company Overview
7.9.2	Financial Performance
7.9.3	Product Benchmarking
7.9.4	Strategic Initiatives
7.10	IDtech 360
7.10.1	Company Overview
7.10.2	Financial Performance
7.10.3	Product Benchmarking
7.10.4	Strategic Initiatives
7.11	Lockheed Martin Corporation
7.11.1	Company Overview
7.11.2	Financial Performance
7.11.3	Product Benchmarking
7.11.4	Strategic Initiatives
7.12	Lumidigm (HID Biometrics)
7.12.1	Company Overview
7.12.2	Financial Performance
7.12.3	Product Benchmarking
7.12.4	Strategic Initiatives
7.13	Manage ID
7.13.1	Company Overview
7.13.2	Financial Performance
7.13.3	Product Benchmarking
7.13.4	Strategic Initiatives
7.14	Merkatum Corporation
7.14.1	Company Overview
7.14.2	Financial Performance
7.14.3	Product Benchmarking
7.14.4	Strategic Initiatives
7.15	MorphoTrust USA
7.15.1	Company Overview
7.15.2	Financial Performance
7.15.3	Product Benchmarking
7.15.4	Strategic Initiatives
7.16	NEC Corporation of America
7.16.1	Company Overview
7.16.2	Financial Performance
7.16.3	Product Benchmarking
7.16.4	Strategic Initiatives
7.17	Safran
7.17.1	Company Overview
7.17.2	Financial Performance
7.17.3	Product Benchmarking
7.17.4	Strategic Initiatives
7.18	SecuGen Corporation
7.18.1	Company Overview
7.18.2	Financial Performance
7.18.3	Product Benchmarking
7.18.4	Strategic Initiatives
7.19	Suprema Inc.
7.19.1	Company Overview
7.19.2	Financial Performance
7.19.3	Product Benchmarking
7.19.4	Strategic Initiatives
7.20	Virditech
7.20.1	Company Overview
7.20.2	Financial Performance
7.20.3	Product Benchmarking
7.20.4	Strategic Initiatives
7.21	ZKTeco Inc.
7.21.1	Company Overview
7.21.2	Financial Performance
7.21.3	Product Benchmarking
7.21.4	Strategic Initiatives
List of Tables

TABLE 1	Fingerprint access control - Industry summary and key buying criteria, 2012 - 2022
TABLE 2	Global fingerprint access control market (USD Million)2012 - 2022
TABLE 3	Global market by region (USD Million), 2012 - 2022
TABLE 4	Global market by product, (USD Million), 2012 - 2022
TABLE 5	Global market by application, (USD Million), 2012 – 2022
TABLE 6	Key market participants
TABLE 7	Fingerprint access control – Key market driver impact
TABLE 8	List of key government initiatives
TABLE 9	Fingerprint access control – Key market restraint impact
TABLE 10	Key competitor ranking in the U.S.
TABLE 11	Key players in global security market
TABLE 12	Optical sensing demand (USD Million), 2012 - 2022
TABLE 13	Global optical sensing demand by region (USD Million), 2012 - 2022
TABLE 14	Capacitive sensing demand (USD Million), 2012 - 2022
TABLE 15	Global capacitive sensing demand by region (USD Million), 2012 - 2022
TABLE 16	Pressure sensing demand (USD Million), 2012 - 2022
TABLE 17	Global pressure sensing demand by region (USD Million), 2012 - 2022
TABLE 18	Ultrasonic sensing demand (USD Million), 2012 - 2022
TABLE 19	Global ultrasonic sensing demand by region (USD Million), 2012 - 2022
TABLE 20	Thermal sensing demand (USD Million), 2012 - 2022
TABLE 21	Global thermal sensing demand by region (USD Million), 2012 - 2022
TABLE 22	Global demand in commercial application (USD Million), 2012 - 2022
TABLE 23	Global demand in commercial application by region (USD Million), 2012 – 2022
TABLE 24	Global demand in consumer electronics (USD Million), 2012 - 2022
TABLE 25	Global demand in consumer electronics by region (USD Million), 2012 – 2022
TABLE 26	Global demand in government application (USD Million), 2012 - 2022
TABLE 27	Global demand in government application by region (USD Million), 2012 – 2022
TABLE 28	Global demand in military & defense (USD Million), 2012 - 2022
TABLE 29	Global demand in military & defense by region (USD Million), 2012 – 2022
TABLE 30	Global demand in banking & finance (USD Million), 2012 - 2022
TABLE 31	Global demand in banking & finance by region (USD Million), 2012 – 2022
TABLE 32	Global demand in healthcare (USD Million), 2012 - 2022
TABLE 33	Global demand in healthcare by region (USD Million), 2012 – 2022
TABLE 34	Global demand in other applications (USD Million), 2012 - 2022
TABLE 35	Global demand in other applications by region (USD Million), 2012 – 2022
TABLE 36	North America market by product (USD Million), 2012 – 2022
TABLE 37	North America market by application (USD Million), 2012 – 2022
TABLE 38	U.S. market by product (USD Million), 2012 – 2022
TABLE 39	U.S. market by application (USD Million), 2012 – 2022
TABLE 40	Canada market by product (USD Million), 2012 – 2022
TABLE 41	Canada market by application (USD Million), 2012 – 2022
TABLE 42	Europe market by product (USD Million), 2012 – 2022
TABLE 43	Europe market by application (USD Million), 2012 – 2022
TABLE 44	Germany market by product (USD Million), 2012 – 2022
TABLE 45	Germany market by application (USD Million), 2012 – 2022
TABLE 46	UK market by product (USD Million), 2012 – 2022
TABLE 47	UK market by application (USD Million), 2012 – 2022
TABLE 48	Asia Pacific market by product (USD Million), 2012 – 2022
TABLE 49	Asia Pacific market by application (USD Million), 2012 – 2022
TABLE 50	China market by product (USD Million), 2012 – 2022
TABLE 51	China market by application (USD Million), 2012 – 2022
TABLE 52	India market by product (USD Million), 2012 – 2022
TABLE 53	India market by application (USD Million), 2012 – 2022
TABLE 54	Japan market by product (USD Million), 2012 – 2022
TABLE 55	Japan market by application (USD Million), 2012 – 2022
TABLE 56	Latin America market by product (USD Million), 2012 – 2022
TABLE 57	Latin America market by application (USD Million), 2012 – 2022
TABLE 58	Brazil market by product (USD Million), 2012 – 2022
TABLE 59	Brazil market by application (USD Million), 2012 – 2022
TABLE 60	Mexico market by product (USD Million), 2012 – 2022
TABLE 61	Mexico market by application (USD Million), 2012 – 2022
TABLE 62	MEA market by product (USD Million), 2012 – 2022
TABLE 63	MEA market by application (USD Million), 2012 – 2022

Speak to the report author to design an exclusive study to serve your research needs.
Your personal and confidential information is safe and secure.

