Toll Free: 1-888-928-9744
Toll Free: 1-888-928-9744

Published: Oct, 2015 | Pages:
150 | Publisher: Radiant Insights Inc.
Industry: Technology & Media | Report Format: Electronic (PDF)
The Report Contains Electric Water Heaters Market Size By Application (Commercial, Residential), By Product (Storage, Non-storage/Tankless), Competitive Analysis & Forecast To 2022 Industry Overview Global electric water heaters market size is anticipated to reach USD 29 billion by 2022, growing at 7.4% over the forecast period. Growing commercial and residential projects coupled with increasing disposable income is expected to drive demand growth over the next few years. Escalating demand across extensive range of domestic applications such as cooking, space heating, cleaning and bathing may spur demand extensively. Rising adoption in commercial sector is another key factor spurring demand growth. Increasing growth in construction sectors owing to replacement of outdated water heaters with escalating disposable income could propel industry growth in the near future. According to the U.S., home construction in April 2015 rose 20.2% over March, the biggest percentage jump in almost 24 years. These factors might significantly contribute to the electric water heaters market growth. China region accounted for 12 million units in 2013, and is expected to reach 27 million units by 2022, growing at a CAGR of over 9%. Evolving urban lifestyle, increasing income levels and growing disposable income stimulates customers to spend on consumer utilities like electric water heaters. Additionally, enhanced standard of living and upsurge in consumer awareness pertaining to water heaters benefits may drive the global demand substantially. Technological advancements and innovations are making provisions for efficient & cheap water heaters, subsequently driving market demand extensively. Changing trends towards safety safe is a key force driving the industry demand. Changing consumer preference paired with energy efficiency & quality standards may open avenues for the water heaters market. High operating cost as compared to gas-fired water heaters is expected to obstruct industry growth over the forecast period. Energy required for heating water is the only major component of the whole cost of purchasing and using a water heating system. However, it offer cost benefits over fuel-fired systems pertaining to maintenance, design, service life, installation and impact on space conditioning loads. This cost difference is generally viewed as a little price to pay in order to avoid the potential safety hazards and inconveniences caused due to fuel-fired water heaters.North America electric water heaters market size, by product, 2012-2022 (Million Units)Product Overview Storage was the leading electric water heaters market product segment and was valued over USD 10,000.0 million in 2013. It is anticipated to observe significant gains, with forecast of USD 18,000.0 million at a CAGR of 6% from 2014 to 2022. It is majorly used in regions where electricity accessibility is limited, thus facilitates constant flow of hot water. Non-storage makes use of flow activated switch so as to switch on the heating device consisting of heat exchanger. It is likely to gain significant industry shares owing to stringent energy efficiency regulations and increasing operating cost occurred in storage segment. Application Overview Residential sector accounted for more than 60% of the industry share in 2014, with gains estimated at over 6% from 2014 to 2022. Increasing usage in applications such as cooking, bathing, cleaning and space heating for washing sinks due to low capacity requirements is expected to spur the industry growth. Commercial sector hold the second largest share in the industry, growing at a CAGR of over 8% over the forecast period. Increasing commercial development such as restaurants, schools and hotels among others may drive electric water heaters market demand. Regional Overview Europe electric water heaters market was valued over USD 6,000.0 million in 2013. It is expected to reach 12,000.0 million by 2022 at a CAGR of 7% during the forecast period. North America is predicted to reach USD 6,000.0 million by 2022, owing to increasing investments in residential and commercial construction. Asia Pacific was valued over USD 1,000.0 million in 2013 and is likely to attain USD 3,000.0 million by 2022. The region is expected to grow at a higher rate owing to emerging industries in China and India. Competitive Market Share The global electric water heaters market share is highly competitive, with the top three key players accounting for more than 90% of the total demand in 2013. AO Smith dominated the North American region, with approximately 48% of the industry share in 2014. Rheem accounted for 36% of the regional share in the same year. Bradford White, focuses on wholesale trade and has essentially no retail presence, focusing its sales efforts on wholesalers and contractors. Asia Pacific is expected to grow at a considerable rate over the forecast period. Haier Appliances is expected to be the key player in China followed by AO Smith Corporation. Midea Group is also having significant share in China. In India, Racold is expected to be the key player followed closely by Bajaj, AO Smith, Venus, Haier, and Havells.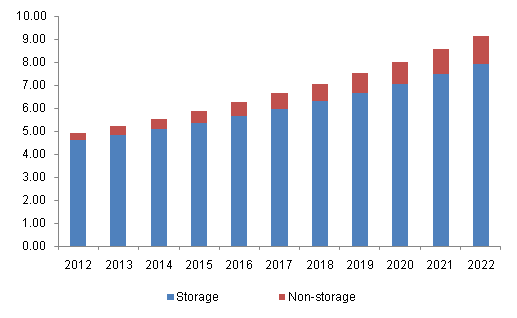
 Table of Contents

Chapter 1	Methodology and Scope
1.1	Research methodology
1.2	Research scope and assumptions
1.3	List of data sources

Chapter 2	Executive Summary
2.1	Electric water heaters - Industry snapshot and key buying criteria, 2012 - 2022

Chapter 3	Electric Water Heaters Industry Overview
3.1	Market segmentation
3.2	Market size and growth prospects
3.3	Electric water heater value chain analysis
3.3.1	Vendor landscape
3.4	Customization
3.4.1	Electric water heater voltage and phase requirement analysis
3.4.2	Electric water heaters applications
3.4.3	Pricing analysis
3.5	Electric water heaters market dynamics
3.5.1	Market driver analysis
3.5.1.1	Increasing residential and commercial projects
3.5.1.2	Rising disposable income
3.5.2	Market restraint analysis
3.5.2.1	High operating cost
3.6	Key opportunities - Prioritized
3.7	Industry analysis - Porter’s
3.8	Electric water heaters company market share, 2014
3.8.1	Company strategy overview
3.9	Electric water heaters PESTEL analysis

Chapter 4	Electric Water Heaters Product Overview
4.1	Electric water heaters market volume share by product, 2014 & 2022
4.2	Storage
4.2.1	Global storage electric water heaters demand by region, 2012 – 2022
4.3	Non-storage
4.3.1	Global non-storage electric water heater demand by region, 2012 – 2022

Chapter 5	Electric Water Heaters Application Overview
5.1	Electric water heaters market volume share by application, 2014 & 2022
5.2	Residential
5.2.1	Global residential electric water heater demand by region, 2012 – 2022
5.3	Commercial
5.3.1	Global commercial electric water heaters demand by region, 2012 – 2022

Chapter 6	Electric Water Heaters Regional Overview
6.1	Electric water heaters market volume share by region, 2014 & 2022
6.2	North America
6.2.1	North America market by product, 2012 – 2022
6.2.2	North America market by application, 2012 – 2022
6.2.3	U.S.
6.2.3.1	U.S. market by product, 2012 – 2022
6.2.3.2	U.S. market by application, 2012 – 2022
6.2.4	Canada
6.2.4.1	Canada market by product, 2012 – 2022
6.2.4.2	Canada market by application, 2012 – 2022
6.3	Europe
6.3.1	Europe market by product, 2012 – 2022
6.3.2	Europe market by application, 2012 – 2022
6.3.3	Germany
6.3.3.1	Germany market by product, 2012 – 2022
6.3.3.2	Germany market by application, 2012 – 2022
6.3.4	UK
6.3.4.1	UK market by product, 2012 – 2022
6.3.4.2	UK market by application, 2012 – 2022
6.4	Asia Pacific
6.4.1	Asia Pacific market by product, 2012 – 2022
6.4.2	Asia Pacific market by application, 2012 – 2022
6.4.3	China
6.4.3.1	China market by product, 2012 – 2022
6.4.3.2	China market by application, 2012 – 2022
6.4.4	India
6.4.4.1	India market by product, 2012 – 2022
6.4.4.2	India market by application, 2012 – 2022
6.4.5	Japan
6.4.5.1	Japan market by product, 2012 – 2022
6.4.5.2	Japan market by application, 2012 – 2022
6.5	Latin America
6.5.1	Latin America market by product, 2012 – 2022
6.5.2	Latin America market by application, 2012 – 2022
6.5.3	Brazil
6.5.3.1	Brazil market by product, 2012 – 2022
6.5.3.2	Brazil market by application, 2012 – 2022
6.5.4	Mexico
6.5.4.1	Mexico market by product, 2012 – 2022
6.5.4.2	Mexico market by application, 2012 – 2022
6.6	MEA
6.6.1	MEA market by product, 2012 – 2022
6.6.2	MEA market by application, 2012 – 2022

Chapter 7	Competitive Landscape
7.1	A.O. Smith
7.1.1	Company Overview
7.1.2	Financial Performance
7.1.3	Product Benchmarking
7.1.4	Strategic Initiatives
7.2	AquaMAX Pty. Ltd
7.2.1	Company Overview
7.2.2	Financial Performance
7.2.3	Product Benchmarking
7.2.4	Strategic Initiatives
7.3	Ariston Thermo
7.3.1	Company Overview
7.3.2	Financial Performance
7.3.3	Product Benchmarking
7.3.4	Strategic Initiatives
7.4	Atwood Mobile Products
7.4.1	Company Overview
7.4.2	Financial Performance
7.4.3	Product Benchmarking
7.4.4	Strategic Initiatives
7.5	Bosch Thermotechnology
7.5.1	Company Overview
7.5.2	Financial Performance
7.5.3	Product Benchmarking
7.6	Bradford White Corporation
7.6.1	Company Overview
7.6.2	Financial Performance
7.6.3	Product Benchmarking
7.6.4	Strategic Initiatives
7.7	Eemax
7.7.1	Company Overview
7.7.2	Financial Performance
7.7.3	Product Benchmarking
7.7.4	Strategic Initiatives
7.8	General Electric (GE)
7.8.1	Company Overview
7.8.2	Financial Performance
7.8.3	Product Benchmarking
7.9	Haier Electronics
7.9.1	Company Overview
7.9.2	Financial Performance
7.9.3	Product Benchmarking
7.9.4	Strategic Initiatives
7.10	Havells
7.10.1	Company Overview
7.10.2	Financial Performance
7.10.3	Product Benchmarking
7.11	Hubbell Incorporated
7.11.1	Company Overview
7.11.2	Financial Performance
7.11.3	Product Benchmarking
7.11.4	Strategic Initiatives
7.12	Kenmore
7.12.1	Company Overview
7.12.2	Financial Performance
7.12.3	Product Benchmarking
7.13	Marey Heater Corporation
7.13.1	Company Overview
7.13.2	Financial Performance
7.13.3	Product Benchmarking
7.14	Racold
7.14.1	Company Overview
7.14.2	Financial Performance
7.14.3	Product Benchmarking
7.14.4	Strategic Initiatives
7.15	Reliance Holmes Heating Inc.
7.15.1	Company Overview
7.15.2	Financial Performance
7.15.3	Product Benchmarking
7.15.4	Strategic Initiatives
7.16	Rheem Manufacturing Company
7.16.1	Company Overview
7.16.2	Financial Performance
7.16.3	Product Benchmarking
7.16.4	Strategic Initiatives
7.17	State Water Heaters
7.17.1	Company Overview
7.17.2	Financial Performance
7.17.3	Product Benchmarking
7.17.4	Strategic Initiatives
7.18	Stiebel Eltron
7.18.1	Company Overview
7.18.2	Financial Performance
7.18.3	Product Benchmarking
7.19	Venus Home Appliances
7.19.1	Company Overview
7.19.2	Financial Performance
7.19.3	Product Benchmarking
7.20	Whirlpool Corporation
7.20.1	Company Overview
7.20.2	Financial Performance
7.20.3	Product Benchmarking
7.20.4	Strategic Initiatives
7.21	Zenith Water Heaters
7.21.1	Company Overview
7.21.2	Financial Performance
7.21.3	Product Benchmarking
List of Tables

TABLE 1	Electric water heaters - Industry snapshot and key buying criteria, 2012 - 2022
TABLE 2	Global electric water heaters market (Volume & Revenue), 2012 - 2022
TABLE 3	Global electric water heater market by region (USD Million), 2012 - 2022
TABLE 4	Global market by region (Million Units), 2012 - 2022
TABLE 5	Global market by product, (USD Million), 2012 - 2022
TABLE 6	Global market by product, (Million Units), 2012 - 2022
TABLE 7	Global market by application, (USD Million), 2012 – 2022
TABLE 8	Global market by application, (Million Units), 2012 – 2022
TABLE 9	Key market participants
TABLE 10	Voltage & phase analysis
TABLE 11	Major regulations & standards
TABLE 12	Electric water heaters – Key market driver impact
TABLE 13	Electric water heaters – Key market restraint impact
TABLE 14	Storage electric water heaters demand (Volume & Revenue), 2012 - 2022
TABLE 15	Global storage electric water heaters demand by region (Million Units), 2012 - 2022
TABLE 16	Global storage electric water heaters demand by region (USD Million), 2012 – 2022
TABLE 17	Non-storage electric water heaters demand (Volume & Revenue), 2012 -2022
TABLE 18	Global non-storage electric water heater demand by region (Million Units), 2012 - 2022
TABLE 19	Global non-storage electric water heater demand by region (USD Million), 2012 – 2022
TABLE 20	Global residential electric water heaters demand (Volume & Revenue), 2012 - 2022
TABLE 21	Global residential electric water heater demand by region (Million Units), 2012 - 2022
TABLE 22	Global residential electric water heater demand by region (USD Million), 2012 – 2022
TABLE 23	Global commercial electric water heaters demand (Volume & Revenue), 2012 - 2022
TABLE 24	Global commercial electric water heaters demand by region (Million Units), 2012 - 2022
TABLE 25	Global commercial electric water heater demand by region (USD Million), 2012 – 2022
TABLE 26	North America market by product (Million Units), 2012 – 2022
TABLE 27	North America market by product (USD Million), 2012 – 2022
TABLE 28	North America market by product (USD Million), 2012 – 2022
TABLE 29	North America market by application (Million Units), 2012 – 2022
TABLE 30	North America market by application (USD Million), 2012 – 2022
TABLE 31	U.S. market by product (Million Units ), 2012 – 2022
TABLE 32	U.S. market by product (USD Million), 2012 – 2022
TABLE 33	U.S. market by application (Million Units), 2012 – 2022
TABLE 34	U.S. electric water heater market by application (USD Million), 2012 – 2022
TABLE 35	Canada market by product (Million Units ), 2012 – 2022
TABLE 36	Canada market by product (USD Million), 2012 – 2022
TABLE 37	Canada market by application (Million Units), 2012 – 2022
TABLE 38	Canada market by application (USD Million), 2012 – 2022
TABLE 39	Europe market by product (Million Units), 2012 – 2022
TABLE 40	Europe market by product (USD Million), 2012 – 2022
TABLE 41	Europe market by application (Million Units), 2012 – 2022
TABLE 42	Europe market by application (USD Million), 2012 – 2022
TABLE 43	Germany market by product (Million Units ), 2012 – 2022
TABLE 44	Germany market by product (USD Million), 2012 – 2022
TABLE 45	Germany market by application (Million Units), 2012 – 2022
TABLE 46	Germany market by application (USD Million), 2012 – 2022
TABLE 47	UK market by product (Million Units ), 2012 – 2022
TABLE 48	UK market by product (USD Million), 2012 – 2022
TABLE 49	UK market by application (Million Units), 2012 – 2022
TABLE 50	UK market by application (USD Million), 2012 – 2022
TABLE 51	Asia Pacific market by product (Million Units), 2012 – 2022
TABLE 52	Asia Pacific market by product (USD Million), 2012 – 2022
TABLE 53	Asia Pacific market by application (Million Units), 2012 – 2022
TABLE 54	Asia Pacific market by application (USD Million), 2012 – 2022
TABLE 55	China market by product (Million Units ), 2012 – 2022
TABLE 56	China market by product (USD Million), 2012 – 2022
TABLE 57	China market by application (Million Units), 2012 – 2022
TABLE 58	China market by application (USD Million), 2012 – 2022
TABLE 59	India market by product (Million Units ), 2012 – 2022
TABLE 60	India market by product (USD Million), 2012 – 2022
TABLE 61	India market by application (Million Units), 2012 – 2022
TABLE 62	India market by application (USD Million), 2012 – 2022
TABLE 63	Japan market by product (Thousand Units), 2012 – 2022
TABLE 64	Japan market by product (USD Million), 2012 – 2022
TABLE 65	Japan market by application (Thousand Units), 2012 – 2022
TABLE 66	Japan market by application (USD Million), 2012 – 2022
TABLE 67	Latin America market by product (Million Units), 2012 – 2022
TABLE 68	Latin America market by product (USD Million), 2012 – 2022
TABLE 69	Latin America market by application (Million Units), 2012 – 2022
TABLE 70	Latin America market by application (USD Million), 2012 – 2022
TABLE 71	Brazil market by product (Million Units ), 2012 – 2022
TABLE 72	Brazil market by product (USD Million), 2012 – 2022
TABLE 73	Brazil market by application (Million Units), 2012 – 2022
TABLE 74	Brazil market by application (USD Million), 2012 – 2022
TABLE 75	Mexico market by product (Million Units ), 2012 – 2022
TABLE 76	Mexico market by product (USD Million), 2012 – 2022
TABLE 77	Mexico market by application (Million Units), 2012 – 2022
TABLE 78	Mexico market by application (USD Million), 2012 – 2022
TABLE 79	MEA market by product (Million Units), 2012 – 2022
TABLE 80	MEA market by product (USD Million), 2012 – 2022
TABLE 81	MEA market by application (Million Units), 2012 – 2022
TABLE 82	MEA market by application (USD Million), 2012 – 2022

List of Figures

FIG. 1	Electric water heaters market segmentation
FIG. 2	Global electric water heaters market, (Volume & Revenue), 2012 – 2022
FIG. 3	Electric water heater value chain analysis
FIG. 4	Electric water heaters market dynamics
FIG. 5	U.S. personal disposable income, 2014 - 2015 (USD Billion)
FIG. 6	Key Opportunities Prioritized
FIG. 7	Electric water heaters - Porter’s analysis
FIG. 8	North America electric water heaters company market share analysis, 2014
FIG. 9	Electric water heaters PESTEL analysis
FIG. 10	Electric water market volume share by product, 2014 & 2022
FIG. 11	Storage electric water heaters demand (Volume & Revenue) 2012 - 2022
FIG. 12	Non-storage electric water heaters demand (Volume & Revenue), 2012 – 2022
FIG. 13	Electric water heater market volume share by application, 2014 & 2022
FIG. 14	Residential electric water heater demand (Volume & Revenue), 2012 – 2022
FIG. 15	Commercial electric water heaters demand (Volume & Revenue), 2012 – 2022
FIG. 16	Electric water heaters market volume share by region, 2014 & 2022
FIG. 17	North America market by product (Million Units), 2012 – 2022
FIG. 18	North America market by product (USD Million), 2012 – 2022
FIG. 19	North America market by application (Million Units), 2012 – 2022
FIG. 20	North America market by application (USD Million), 2012 – 2022
FIG. 21	U.S. market by product (Million Units), 2012 – 2022
FIG. 22	U.S. market by product (USD Million), 2012 – 2022
FIG. 23	U.S. market by application (Million Units), 2012 – 2022
FIG. 24	U.S. market by application (USD Million), 2012 – 2022
FIG. 25	Canada market by product (Million Units ), 2012 – 2022
FIG. 26	Canada market by product (USD Million), 2012 – 2022
FIG. 27	Canada market by application (Million Units), 2012 – 2022
FIG. 28	Canada market by application (USD Million), 2012 – 2022
FIG. 29	Europe market by product (Million Units), 2012 – 2022
FIG. 30	Europe market by product (USD Million), 2012 – 2022
FIG. 31	Europe market by application (Million Units), 2012 – 2022
FIG. 32	Europe market by application (USD Million), 2012 – 2022
FIG. 33	Germany market by product (Million Units ), 2012 – 2022
FIG. 34	Germany market by product (USD Million), 2012 – 2022
FIG. 35	Germany market by application (Million Units), 2012 – 2022
FIG. 36	Germany market by application (USD Million), 2012 – 2022
FIG. 37	UK market by product (Million Units), 2012 – 2022
FIG. 38	UK. market by product (USD Million), 2012 – 2022
FIG. 39	UK market by application (Million Units), 2012 – 2022
FIG. 40	UK market by application (USD Million), 2012 – 2022
FIG. 41	Asia Pacific market by product (Million Units), 2012 – 2022
FIG. 42	Asia Pacific market by product (USD Million), 2012 – 2022
FIG. 43	Asia Pacific market by application (Million Units), 2012 – 2022
FIG. 44	Asia Pacific market by application (USD Million), 2012 – 2022
FIG. 45	China market by product (Million Units), 2012 – 2022
FIG. 46	China market by product (USD Million), 2012 – 2022
FIG. 47	China market by application (Million Units), 2012 – 2022
FIG. 48	China market by application (USD Million), 2012 – 2022
FIG. 49	India market by product (Million Units ), 2012 – 2022
FIG. 50	India market by product (USD Million), 2012 – 2022
FIG. 51	India market by application(Million Units), 2012 – 2022
FIG. 52	India market by application (USD Million), 2012 – 2022
FIG. 53	Japan market by product (Thousand Units), 2012 – 2022
FIG. 54	Japan market by product (USD Million), 2012 – 2022
FIG. 55	Japan market by application (Thousand Units), 2012 – 2022
FIG. 56	Japan market by application (USD Million), 2012 – 2022
FIG. 57	Latin America market by product (Million Units), 2012 – 2022
FIG. 58	Latin America market by product (USD Million), 2012 – 2022
FIG. 59	Latin America market by application (Million Units), 2012 – 2022
FIG. 60	Latin America market by application (USD Million), 2012 – 2022
FIG. 61	Brazil market by product (Million Units), 2012 – 2022
FIG. 62	Brazil market by product (USD Million), 2012 – 2022
FIG. 63	Brazil market by application (Million Units), 2012 – 2022
FIG. 64	Brazil market by application (USD Million), 2012 – 2022
FIG. 65	Mexico market by product (Million Units ), 2012 – 2022
FIG. 66	Mexico market by product (USD Million), 2012 – 2022
FIG. 67	Mexico market by application (Million Units), 2012 – 2022
FIG. 68	Mexico market by application (USD Million), 2012 – 2022
FIG. 69	MEA market by product (Million Units), 2012 – 2022
FIG. 70	MEA market by product (USD Million), 2012 – 2022
FIG. 71	MEA market by application (Million Units), 2012 – 2022
FIG. 72	MEA market by application (USD Million), 2012 – 2022

Speak to the report author to design an exclusive study to serve your research needs.
Your personal and confidential information is safe and secure.

