Toll Free: 1-888-928-9744
Toll Free: 1-888-928-9744

Published: Oct, 2015 | Pages:
79 | Publisher: Radiant Insights Inc.
Industry: Textiles | Report Format: Electronic (PDF)
The Report Contains Coated Fabric Market Size By Application (Transportation, Protective Clothing, Industrial, Furniture), By Product (Polymer, Rubber, Fabric Backed Wall Coverings), And Competitive Analysis & Forecast, 2012 - 2020 Industry Overview Global coated fabrics market size is expected to reach 4,400 million square meters by 2020, growing at a CAGR of 3.8% from 2014 to 2020. Increasing application scope in automotive applications is expected to drive coated fabrics market growth over the forecast period. It is used in the production of airbags and seat covers among others. Since these are essential elements of an automobile, rise in vehicles demand is likely to favor coated fabrics industry growth. The global automotive sales have been on the rise primarily driven by countries such as India, China, Brazil and the U.S. The production of automobiles in China crossed 2.2 million units in 2013 from 0.8 million in 2007. Increasing protective clothing demand for industrial applications is likely to surge industry growth. Protective clothing produced from coated fabrics is used in a number of industries (e.g., agriculture, chemical processing, food processing, law enforcement, and medical, military) where participants must be shielded from chemicals, heat, biological contaminants, or other environmental risks The increase in the protective clothing demand is owing to the government initiatives such as Model Work Health and Safety Act by Australian government and European Union’s Directive 89/686/EEC. Protective clothing made from coated fabrics includes aprons, chemical and hazardous material suits, clean room clothing, cut- and slash-resistant clothing, gloves, footwear, reflective clothing, and space suits. Global increase in infrastructure spending is expected to drive demand over the next six years. They are used as wall coverings, awnings and canopies in residential as well as nonresidential structures. Stringent norms by regulatory authorities such as EPA and CPSIA over volatile organic compounds (VOC) release are expected to inhibit industry growth. Substitute threats from materials such as leather and plastic are also likely to challenge coated fabric market participants.North America coated fabrics market size, by product, 2012-2020 (Million Square Meters)Product Overview Polymer coated fabrics market was the largest product segment with valuation of over USD 13.5 billion in 2013. The main feature is that they are manufactured at a relatively low cost and can be used in a wide range of applications, including awnings, seating, industrial curtains and upholstery. Majority of polymer based product are used in automotive accessories applications such as airbags & seat covers and protective clothing. Rubber based product accounted for more than 8% of the demand in 2013 and are expected to witness moderate gains of over 2% up to 2020 owing to the property of flexibility and resistance to degradation which is expected to replace polymers used in coating for airbags and some protective clothing applications. The property of elasticity of rubber acts as a major factor for preferring the rubber coated fabrics than polymer and wall-backed coverings. Application Overview Transportation was the dominant application with revenue generation of over USD 5.5 billion in 2013. Transportation sector is expected to witness growth owing to increasing use of airbags as well as stringent norms by government for ensuring safety comforts for driving and making airbags to be used in every vehicles. Increasing demand of automobiles coupled with the infrastructural developments meant for railway and metro-rail stations is anticipated to drive coated fabrics market growth. Protective clothing applications accounted for more than 20% of the total volume in 2013 and are expected witness above average growth rate of over 4% from 2014 to 2020. The growth in demand of coated fabrics in protective clothing is owing to the government initiatives and awareness in terms of ensuring safety to the workers in industrial environment. Furniture applications are likely to exhibit highest growth rates of over 5% up to 2020. They are used as furniture upholstery to provide a durable, stain resistant, and easy-to-clean surface in a variety of colors, patterns, and textures. Regional Overview Asia Pacific coated fabrics market was the dominant regional industry with revenue generation exceeding USD 7.5 billion. Presence of large scale industries coupled with growth in automobile production in countries such as China, India, Indonesia and Thailand is expected to drive regional demand. Europe accounted for more than 17% of total demand and is expected to witness below average growth rates at CAGR of over 3% from 2014 to 2020. Government safety norms for industrial protective clothing coupled with presence of automobile manufacturing base is likely to surge demand. Competitive Market Share The global coated fabrics market share is highly fragmented with the top six participants contributing approximately 26% of the total demand. Omnova Solutions was the largest company in the global scenario with a share of over 5% in 2013. Key companies include Saint Gobain, Takata Corporation, Spradling International, Trelleborg AB, Mauritzon Inc., Bo-Tex Sales, Isotex S.p.A and ContiTech AG.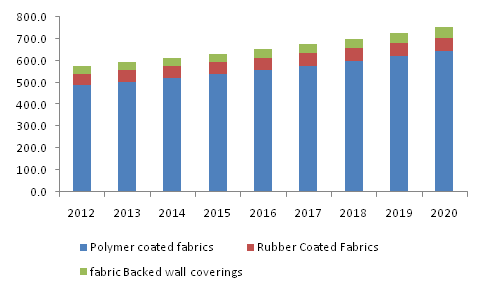
 Table of Content

Chapter 1	Executive Summary

Chapter 2	Coated Fabrics Industry Overview
2.1	Market segmentation
2.2	Market Size and Growth Prospects
2.3	Coated Fabrics - Value Chain Analysis
2.4	Coated Fabrics Market – Market dynamics
2.4.1	Market driver analysis
2.4.1.1	Growing automotive market
2.4.1.2	Growing demand for protective clothing
2.4.1.3	Growing construction industry
2.4.2	Market restraint analysis
2.4.2.1	Environmental Concern
2.4.2.2	Availability of substitute products
2.5	Industry Analysis – Porter’s
2.6	Coated Fabrics competitive landscape analysis, 2013
2.7	Coated Fabrics PESTEL Analysis

Chapter 3	Coated Fabric Product Overview
3.1	Coated Fabric market volume by Product, 2013 and 2020
3.2	Polymer Coated Fabrics
3.2.1	Global demand for polymer coated fabrics, 2012 - 2020 (million square meters) (USD million)
3.2.2	Global demand for polymer coated fabrics by region (million square meters) (USD million)

3.3	Rubber coated fabrics
3.3.1	Global demand for Rubber coated fabrics, 2012 - 2020 (million square meters) (USD million)
3.3.2	Global demand for Rubber coated fabrics by region (million square meters) (USD million)
3.4	Fabric backed wall coverings
3.4.1	Global demand for Fabric backed wall coverings, 2012 - 2020 (million square meters) (USD million)
3.4.2	Global demand for Fabric backed wall coverings by region (million square meters) (USD million)

Chapter 4	Coated Fabric Application Overview
4.1	Coated Fabric market volume share by application, 2013 & 2020
4.2	Transportation
4.2.1	Market estimates and forecasts, 2012-2020 (million square meters) (USD million)
4.2.2	Market estimates and forecasts by region, 2012-2020 (million square meters) (USD million)
4.3	Protective clothing
4.3.1	Market estimates and forecasts, 2012-2020 (million square meters) (USD million)
4.3.2	Market estimates and forecasts by region, 2012-2020 (million square meters) (USD million)
4.4	Industrial
4.4.1	Market estimates and forecasts, 2012-2020 (million square meters) (USD million)
4.4.2	Market estimates and forecasts by region, 2012-2020 (million square meters) (USD million)
4.5	Furniture
4.5.1	Market estimates and forecasts, 2012-2020 (million square meters) (USD million)
4.5.2	Market estimates and forecasts by region, 2012-2020 (million square meters) (USD million)
4.6	Others
4.6.1	Market estimates and forecasts, 2012-2020 (million square meters) (USD million)
4.6.2	Market estimates and forecasts by region, 2012-2020 (million square meters) (USD million)

Chapter 5	Coated Fabrics Regional Overview
5.1	Coated Fabrics market share by region, 2013 and 2020
5.2	North America
5.2.1	Market estimates and forecasts, 2012-2020 (million square meters) (USD million)
5.2.2	Market estimates and forecasts by product, 2012-2020 (million square meters) (USD million)
5.2.3	Market estimates and forecasts by application, 2012-2020 (million square meters) (USD million)
5.3	Europe
5.3.1	Market estimates and forecasts, 2012-2020 (million square meters) (USD million)
5.3.2	Market estimates and forecasts by product, 2012 – 2020 (million square meters) (USD million)
5.3.3	Market estimates and forecasts by application, 2012-2020 (million square meters) (USD million)
5.4	Asia Pacific
5.4.1	Market estimates and forecasts, 2012-2020 (million square meters) (USD million)
5.4.2	Market estimates and forecasts by product, 2012 – 2020 (million square meters) (USD million)
5.4.3	Market estimates and forecasts by application, 2012-2020 (million square meters) (USD million)
5.5	RoW
5.5.1	Market estimates and forecasts, 2012-2020 (million square meters) (USD million)
5.5.2	R Market estimates and forecasts by product, 2012 – 2020 (million square meters) (USD million)
5.5.3	Market estimates and forecasts by application, 2012-2020 (million square meters) (USD million)

Chapter 6	Coated Fabrics Competitive Landscape
6.1	Omnova Solutions
6.1.1	Company Overview
6.1.2	Financial Performance
6.1.3	Product Benchmarking
6.1.4	Strategic Initiatives
6.2	Saint-Gobain S.A.
6.2.1	Company Overview
6.2.2	Financial Performance
6.2.3	Product Benchmarking
6.2.4	Strategic Initiatives
6.3	Spradling International Inc.
6.3.1	Company Overview
6.3.2	Financial Performance
6.3.3	Product Benchmarking
6.3.4	Strategic Initiatives
6.4	Takata Corporation
6.4.1	Company Overview
6.4.2	Financial Performance
6.4.3	Product Benchmarking
6.4.4	Strategic Initiatives
6.5	Trelleborg AB
6.5.1	Company Overview
6.5.2	Financial Performance
6.5.3	Product Benchmarking
6.5.4	Strategic Initiatives
6.6	Bo-Tex Sales Co
6.6.1	Company Overview
6.6.2	Financial Performance
6.6.3	Product Benchmarking
6.7	Mauritzon Inc.
6.7.1	Company Overview
6.7.2	Financial Performance
6.7.3	Product Benchmarking
6.8	ContiTech AG
6.8.1	Company Overview
6.8.2	Financial Performance
6.8.3	Product Benchmarking
6.8.4	Strategic Initiatives
6.9	Isotex S.p.A
6.9.1	Company Profile
6.9.2	Financial Performance
6.9.3	Product Benchmarking
6.9.4	Strategic Initiatives
6.10	Graniteville Specialty Fabrics
6.10.1	Company Overview
6.10.2	Financial Performance
6.10.3	Product Benchmarking
6.10.4	Strategic Initiatives

Chapter 7	Methodology and Scope
7.1	Research Methodology
7.2	Research Scope & Assumptions
7.3	List of Data Sources
List of Tables

TABLE 1	Coated Fabrics – Industry Summary & Critical Success Factors (CSFs)
TABLE 2	Global coated Fabrics market volume and revenue, 2012 – 2020
TABLE 3	Global coated fabrics market volume by region (million square meters), 2012 - 2020
TABLE 4	Global coated fabrics revenue by region, (USD million), 2012 - 2020
TABLE 5	Global coated fabrics volume by application (million square meters), 2012 - 2020
TABLE 6	Global coated fabrics volume by application, (USD Million), 2012 - 2020
TABLE 7	Coated Fabrics – Key market driver analysis
TABLE 8	Coated Fabrics – Key market restraint analysis
TABLE 9	Global Polymer Coated Fabric market by volume and revenue, 2012 – 2020 (million square meters) (USD Million)
TABLE 10	Global demand for polymer coated fabrics by region (million square meters)
TABLE 11	Global demand for polymer coated fabrics by region (USD million)
TABLE 12	Global Rubber Coated Fabric market by volume and revenue, 2012 – 2020 (million square meters) (USD Million)
TABLE 13	Global demand for Rubber coated fabrics by region (million square meters)
TABLE 14	Global demand for Rubber coated fabrics by region (USD million)
TABLE 15	Global Fabric backed wall coverings market volume and revenue, 2012 – 2020 (million square meters) (USD Million)
TABLE 16	Global demand for Fabric backed wall coverings by region (million square meters)
TABLE 17	Global demand for Fabric backed wall coverings by region(USD million)
TABLE 18	Global Coated Fabric market volume and revenue from tire, 2012 – 2020 (million square meters) (USD Million)
TABLE 19	Global Coated Fabric market volume and revenue from transportation by region, 2012-2020 (million square meters)
TABLE 20	Global Coated Fabric market volume and revenue from transportation by region, 2012-2020 (USD Million)
TABLE 21	Global Coated Fabrics market volume and revenue from protective clothing, 2012 – 2020 (million square meters) (USD Million)
TABLE 22	Global Coated Fabric market volume and revenue from protective clothing by region, 2012-2020 (million square meters)
TABLE 23	Global Coated Fabric market volume and revenue from protective clothing by region, 2012-2020 (USD Million)
TABLE 24	Global Coated Fabrics market volume and revenue from industrial applications, 2012 – 2020, (Kilo Tons) (USD Million)
TABLE 25	Global Coated Fabric market volume and revenue from industrial applications by region, 2012-2020 (million square meters)
TABLE 26	Global Coated Fabric market volume and revenue from industrial applications by region, 2012-2020 (USD Million)
TABLE 27	Global Coated Fabrics market volume and revenue from furniture, 2012 – 2020 (million square meters) (USD Million)
TABLE 28	Global Coated Fabric market volume and revenue from Furniture by region, 2012-2020 (million square meters)
TABLE 29	Global Coated Fabric market volume and revenue from Furniture by region, 2012-2020 (USD Million)
TABLE 30	Global Coated Fabrics market volume and revenue from other applications, 2012 – 2020 (million square meters) (USD Million)
TABLE 31	Global Coated Fabric market volume and revenue from other applications by region, 2012-2020 (million square meters)
TABLE 32	Global Coated Fabric market volume and revenue from other applications by region, 2012-2020 (USD Million)
TABLE 33	North America Coated Fabrics market, 2012 – 2020 (million square meters) (USD Million)
TABLE 34	North America Coated Fabrics market by product, 2012 – 2020 (million square meters)
TABLE 35	North America Coated Fabrics market by product, 2012 – 2020, (USD million)
TABLE 36	North America Coated Fabrics Market by application (million square meters), 2012 – 2020
TABLE 37	North America Coated Fabrics Market by application, (USD million), 2012 – 2020
TABLE 38	European Coated Fabrics market by product, 2012 – 2020 (million square meters) (USD Million)
TABLE 39	European Coated Fabrics market by product, 2012 – 2020 (million square meters)
TABLE 40	European Coated Fabrics market by product, 2012 – 2020, (USD million)
TABLE 41	European Coated Fabrics Market by application (million square meters), 2012 – 2020
TABLE 42	European Coated Fabrics Market by application, (USD million), 2012 – 2020
TABLE 43	Asia Pacific Coated Fabrics market by product, 2012 – 2020 (million square meters) (USD Million)
TABLE 44	Asia-Pacific Coated Fabrics market by product, 2012 – 2020 (million square meters)
TABLE 45	Asia-Pacific Coated Fabrics market by product, 2012 – 2020, (USD million)
TABLE 46	Asia-Pacific Coated Fabrics Market by application (million square meters), 2012 – 2020
TABLE 47	Asia-Pacific Coated Fabrics Market by application, (USD million), 2012 – 2020
TABLE 48	RoW Coated Fabrics market by product, 2012 – 2020 (million square meters)
TABLE 49	RoW-Pacific Coated Fabrics market by product, 2012 – 2020, (USD million)
TABLE 50	RoW Coated Fabrics Market by application (million square meters), 2012 – 2020
TABLE 51	RoW Coated Fabrics Market by application, (USD million), 2012 – 2020

Speak to the report author to design an exclusive study to serve your research needs.
Your personal and confidential information is safe and secure.

