Toll Free: 1-888-928-9744
Toll Free: 1-888-928-9744

Published: Oct, 2015 | Pages:
96 | Publisher: Radiant Insights Inc.
Industry: Chemicals | Report Format: Electronic (PDF)
The Report Contains Aerosol Propellants Market Size By Application (Households, Personal Care, Paints & Coatings, Medical), By Product (Hydrocarbons, DME, CFC) Competitive Analysis & Forecast, 2012 - 2020 Industry Overview Global aerosol propellants market size is expected to reach 12.5 million tons by 2020, growing at a CAGR of 4.6% from 2014 to 2020. Increasing personal care & cosmetic products demand such as shaving creams, deodorants and hair-sprays is anticipated to drive aerosol propellants demand over the next six years. These products are gaining wide acceptance among the young population particularly in the emerging economies of Asia Pacific and Latin America. Furthermore, growing old age population has propelled use of aerosol in anti-ageing cosmetic products. Introduction of new product formats, gender-specific products, and technological developments is expected to drive demand for personal care products. Increasing use of aerosol propellants in deodorants, styling mousses hair sprays and antiperspirants is expected to drive market growth. Aerosol is also used as spray paints in automobile and construction industry which is expected to drive demand. Global aerosol demand in 2013 was 14,611.8 million units and is expected to reach 18,040.5 million units, growing at a CAGR of 3.1% from 2014 to 2020. Increasing awareness for hygiene coupled with home furnishing market growth is expected to drive aerosol demand in household applications. Rising government spending for infrastructure improvement in China, India, and Brazil is expected to fuel aerosol paint demand in construction. Increasing automobile production in China, Mexico, Germany, Brazil, and Indonesia is expected to positively influence the market. These factors are expected to drive aerosol propellants market. The market is further expected to witness growth owing to the support from the U.S. EPA for hydrocarbon propellants as they have zero ozone depletion potential and less atmospheric residence time and, thus, do not contribute to global warming. Health and environmental issues associated with propellants use in aerosol products is expected to challenge industry participant’s growth. Investments in research for technological up-gradation to produce low VOC and eco-friendly products are expected to open new avenues for industry.North America aerosol propellants market, by product, 2012-2020 (Kilo tons)Product Overview Hydrocarbons were the leading product segment with a market valuation exceeding USD 13 billion in 2013. Hydrocarbons were the largest product segment, accounting for 82.5% of global market share in 2013. Hydrocarbons including isobutene, propane, ethane and n-butane provide high stability, lower costs and less toxicity in comparison to other propellants which is expected to contribute towards its high market share over the past few years. DME & methyl ethyl ether accounted for more than 8% of the market share and is expected to witness significant growth rates with CAGR of over 5% up to 2020. This product is expected to grow owing to the numerous advantages including solvency and water miscibility making it useful in various products such as paint sprays and hairsprays. Nitrous oxide & carbon dioxide product is expected to exceed a market valuation of USD 2 billion by 2020 by witnessing above average growth rates. Increasing carbon dioxide & nitrous oxide demand to dispense dental creams, food products, ointments and hair preparations is likely to surge aerosol propellants market growth. Application Overview Personal care was the leading application for aerosol propellants market with valuation exceeding USD 6.5 billion in 2013. Rising health concerns and growing demand for hygienic products is expected to increase the importance of personal care products including infant care, skin care, deodorants, antiperspirants and hair care. Household application accounted for more than 32% of the market share in 2013 and is expected to grow is higher growth rates up to 2020. They are used in myriad household applications such as stain removers, pre-wash sprays, shoe polish, starch, water repellents for leather & fabric, cleaning agents in rugs, fabrics & household surfaces, furniture polishes & waxes, room disinfectants & fresheners, air fresheners & anti-static sprays. Automotive & industrial applications accounted for more than 8% of the market share in 2013 and are likely to grow at higher CAGR of over 5% up to 2020. Aerosol propellants find use in formulation of adhesives & sealants, anti-fog agents, lubricants, and automotive cleaning agents. Increasing preference towards preventive maintenance in industrial and automotive applications owing to reduce production cost is expected to promote demand for adhesives & sealants and lubricants. Paint applications are expected to witness significant growth rates over the forecast period owing to increasing use of spray painting technology in automotive and construction sector. Regional Overview Europe was the leading regional market with revenues exceeding USD 6.8 billion in 2013. Robust manufacturing base of cosmetic products in Germany, France, Spain and UK is expected to increase the demand. North America was the second largest market and accounted for more than 25% of the share in 2013. Positive outlook on automobile industry in the U.S. and Mexico is expected to fuel aerosol propellants demand in the near future. Asia Pacific aerosol propellants market is likely to witness significant growth rates with an estimated CAGR of over 5.5% up to 2020. This region is expected see an increase in infrastructure spending coupled with growth in automobile production particularly in countries such as China, Indonesia, India and Thailand. Competitive Market Share Honeywell was the largest company in the aerosol propellants market share accounting for over 15% of the global market in 2013. In July 2012, Honeywell launched a new product range, Solstice Propellants, which is non-ozone-depleting, and has low GWP (global warming potential) and is non-flammable and find applications in personal care products. Bayer accounted for more than 10% of the market and offers propellants used in hair sprays and cream. Some of the other key players include AkzoNobel, Lapolla Industries Inc., Aeropres Corporation, Harp International and Aveflor.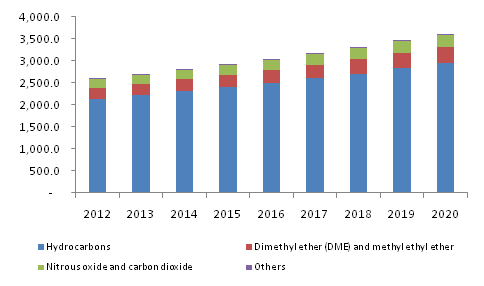
 Table of Contents

Chapter 1	Executive Summary

Chapter 2	Aerosol Propellants Industry Overview
2.1	Aerosol propellants market segmentation
2.2	Aerosol propellants market size and growth prospects, 2012 - 2020
2.3	Aerosol propellants value chain analysis
2.4	Aerosol propellants market dynamics
2.4.1	Market driver analysis
2.4.1.1	Increasing demand for aerosol products
2.4.1.2	Growth of aerosol consumption in personal care
2.4.1.3	Growing paints & coatings industry in Asia Pacific
2.4.2	Market restraints analysis
2.4.2.1	Environment concerns
2.5	Aerosol propellants key opportunities prioritized
2.6	Aerosol propellants Porter’s analysis
2.7	Aerosol propellants company market share analysis, 2013
2.8	Aerosol propellants PESTEL analysis

Chapter 3	Aerosol Propellants Product Overview
3.1	Global aerosol propellants market volume share by product, 2013 & 2020
3.2	Hydrocarbons
3.2.1	Market demand estimates and forecast, 2012-2020, (Kilo Tons) (USD Million)
3.2.2	Market demand estimates and forecast, by region, 2012-2020, (Kilo Tons) (USD Million)
3.3	DME and methyl ethyl ether
3.3.1	Market demand estimates and forecast, 2012-2020, (Kilo Tons) (USD Million)
3.3.2	Market demand estimates and forecast, by region, 2012-2020, (Kilo Tons) (USD Million)
3.4	Nitrous oxide and carbon dioxide
3.4.1	Market demand estimates and forecast, 2012-2020, (Kilo Tons) (USD Million)
3.4.2	Market demand estimates and forecast, by region, 2012-2020, (Kilo Tons) (USD Million)
3.5	Others
3.5.1	Market demand estimates and forecast, 2012-2020, (Kilo Tons) (USD Million)
3.5.2	Market demand estimates and forecast, by region, 2012-2020, (Kilo Tons) (USD Million)

Chapter 4	Aerosol Propellants Application Overview
4.1	Global aerosol propellants market volume share by application, 2013 & 2020
4.2	Personal care
4.2.1	Market demand estimates and forecast in personal care, 2012-2020, (Kilo Tons) (USD Million)
4.2.2	Market demand in personal care, by region, 2012-2020, (Kilo Tons) (USD Million)
4.3	Household
4.3.1	Market demand estimates and forecast in household, 2012-2020, (Kilo Tons) (USD Million)
4.3.2	Market demand from household, by region, 2012-2020, (Kilo Tons) (USD Million)
4.4	Automotive & industrial
4.4.1	Market demand estimates and forecast in automotive & industrial, 2012-2020, (Kilo Tons) (USD Million)
4.4.2	Market demand in automotive & industrial, by region, 2012-2020, (Kilo Tons) (USD Million)
4.5	Foods
4.5.1	Market demand estimates and forecast in foods, 2012-2020, (Kilo Tons) (USD Million)
4.5.2	Market demand in foods, by region, 2012-2020, (Kilo Tons) (USD Million)
4.6	Paints
4.6.1	Market demand estimates and forecast in paints, 2012-2020, (Kilo Tons) (USD Million)
4.6.2	Market demand in paints, by region, 2012-2020, (Kilo Tons) (USD Million)
4.7	Medical
4.7.1	Market demand estimates and forecast in medical, 2012-2020, (Kilo Tons) (USD Million)
4.7.2	Market demand in medical, by region, 2012-2020, (Kilo Tons) (USD Million)
4.8	Others
4.8.1	Market demand estimates and forecast in others, 2012-2020, (Kilo Tons) (USD Million)
4.8.2	Market demand in other applications, by region, 2012-2020, (Kilo Tons) (USD Million)

Chapter 5	Aerosol Propellants Regional Overview
5.1	Global aerosol propellants market volume share by region, 2013 & 2020
5.2	North America
5.2.1	Aerosol propellants market estimates and forecast, 2012-2020 (Kilo Tons) (USD Million)
5.2.2	Market estimates and forecast, by product, 2012-2020 (Kilo Tons) (USD Million)
5.2.3	Market estimates and forecast, by application, 2012-2020 (Kilo Tons) (USD Million)
5.3	Latin America
5.3.1	Aerosol propellants market estimates and forecast, 2012-2020 (Kilo Tons) (USD Million)
5.3.2	Market estimates and forecast, by product, 2012-2020 (Kilo Tons) (USD Million)
5.3.3	Market estimates and forecast, by application, 2012-2020 (Kilo Tons) (USD Million)
5.4	Europe
5.4.1	Aerosol propellants market estimates and forecast, 2012-2020 (Kilo Tons) (USD Million)
5.4.2	Market estimates and forecast, by product, 2012-2020 (Kilo Tons) (USD Million)
5.4.3	Market estimates and forecast, by application, 2012-2020 (Kilo Tons) (USD Million)
5.5	Asia Pacific
5.5.1	Aerosol propellants market estimates and forecast, 2012-2020 (Kilo Tons) (USD Million)
5.5.2	Market estimates and forecast, by product, 2012-2020 (Kilo Tons) (USD Million)
5.5.3	Market estimates and forecast, by application, 2012-2020 (Kilo Tons) (USD Million)
5.6	MEA
5.6.1	Aerosol propellants market estimates and forecast, 2012-2020 (Kilo Tons) (USD Million)
5.6.2	Market estimates and forecast, by product, 2012-2020 (Kilo Tons) (USD Million)
5.6.3	Market estimates and forecast, by application, 2012-2020 (Kilo Tons) (USD Million)

Chapter 6	Competitive Landscape
6.1	Aveflor
6.1.1	Company Overview
6.1.2	Financial Performance
6.1.3	Product Benchmarking
6.2	DuPont
6.2.1	Company Overview
6.2.2	Financial Performance
6.2.3	Product Benchmarking
6.2.4	Strategic Initiatives
6.3	Honeywell
6.3.1	Company Overview
6.3.2	Financial Performance
6.3.3	Product Benchmarking
6.3.4	Strategic Initiatives
6.4	Aeropres Corporation
6.4.1	Company Overview
6.4.2	Financial Performance
6.4.3	Product Benchmarking
6.4.4	Strategic Initiatives
6.5	BOC Industrial Gases
6.5.1	Company Overview
6.5.2	Financial Performance
6.5.3	Product Benchmarking
6.6	Lapolla Industries Inc.
6.6.1	Company Overview
6.6.2	Financial Performance
6.6.3	Product Benchmarking
6.6.4	Strategic Initiatives
6.7	AkzoNobel
6.7.1	Company Overview
6.7.2	Financial Performance
6.7.3	Product Benchmarking
6.7.4	Strategic Initiatives
6.8	Bayer MaterialScience AG
6.8.1	Company Overview
6.8.2	Financial Performance
6.8.3	Product Benchmarking
6.8.4	Strategic Initiatives
6.9	Emirates Gas
6.9.1	Company Overview
6.9.2	Financial Overview
6.9.3	Product Benchmarking
6.10	K-G Packaging
6.10.1	Company Overview
6.10.2	Financial Performance
6.10.3	Product Benchmarking
6.11	National Gas Company SAOG
6.11.1	Company Overview
6.11.2	Financial Performance
6.11.3	Product Benchmarking
6.12	Shanghai Cal Custom Manufacturing & Aerosol Propellants Co., Ltd.
6.12.1	Company Overview
6.12.2	Financial Performance
6.12.3	Product Benchmarking
6.13	Harp International
6.13.1	Company Overview
6.13.2	Financial Performance
6.13.3	Product Benchmarking
6.13.4	Strategic Initiatives
6.14	Diversified CPC International, Inc.
6.14.1	Company Overview
6.14.2	Financial Performance
6.14.3	Product Benchmarking
6.14.4	Strategic Initiatives
6.15	Volcke Aerosol Company NV
6.15.1	Company Overview
6.15.2	Financial Performance
6.15.3	Product Benchmarking
6.15.4	Strategic Initiatives
6.16	Aerochem
6.16.1	Company Overview
6.16.2	Financial Performance
6.16.3	Product Benchmarking
6.17	Aerosol Service GmbH
6.17.1	Company Overview
6.17.2	Financial Performance
6.17.3	Product Benchmarking
6.18	Aztec Aerosols Ltd.
6.18.1	Company Overview
6.18.2	Financial Performance
6.19	Aero-Spray AB
6.19.1	Company Overview
6.19.2	Financial Performance
6.20	Eugenio Santos Envasados Y Servicios SL
6.20.1	Company Overview
6.20.2	Financial Performance
6.21	IGS Aerosols GmbH
6.21.1	Company Overview
6.21.2	Product Benchmarking
6.21.3	Financial Performance
6.22	Aerosan AG
6.22.1	Company Overview
6.22.2	Financial Performance
6.22.3	Product Benchmarking

Chapter 7	Research Methodology
7.1	Research Methodology
7.2	Research Scope & Assumptions
7.3	List of Data Sources
List of Tables

TABLE 1	Aerosol Propellants – Industry Summary & Key Buying Criteria, 2012 - 2020
TABLE 2	Global aerosol propellants market, 2012 – 2020 (Kilo Tons) (USD Million)	14
TABLE 3	Global aerosol propellants market volume, by region, 2012 – 2020 (Kilo Tons)
TABLE 4	Global aerosol propellants market revenue, by region, 2012 – 2020 (USD Million)
TABLE 5	Global aerosol propellants market volume, by product, 2012 – 2020 (Kilo Tons)
TABLE 6	Global aerosol propellants market revenue, by product, 2012 – 2020 (USD Million)
TABLE 7	Global aerosol propellants market volume, by application, 2012 – 2020 (Kilo Tons)
TABLE 8	Global aerosol propellants market revenue, by application, 2012 – 2020 (USD Million)
TABLE 9	Aerosol propellants - Key market driver analysis
TABLE 10	Aerosol propellants - Key market restraint analysis
TABLE 11	Hydrocarbons market demand estimates and forecast, 2012-2020, (Kilo Tons) (USD Million)
TABLE 12	Hydrocarbons market volume estimates and forecast, by region, 2012-2020, (Kilo Tons)
TABLE 13	Hydrocarbons market revenue estimates and forecast, by region, 2012-2020, (USD Million)
TABLE 14	DME and methyl ethyl ether market demand estimates and forecast, 2012-2020, (Kilo Tons) (USD Million)
TABLE 15	DME and methyl ethyl ether market volume estimates and forecast, by region, 2012-2020, (Kilo Tons)
TABLE 16	 DME and methyl ethyl ether market revenue estimates and forecast, by region, 2012-2020, (USD Million)
TABLE 17	Nitrous oxide and carbon dioxide market demand estimates and forecast, 2012-2020, (Kilo Tons) (USD Million)
TABLE 18	Nitrous oxide and carbon dioxide market volume estimates and forecast, by region, 2012-2020, (Kilo Tons)
TABLE 19	Nitrous oxide and carbon dioxide market revenue estimates and forecast, by region, 2012-2020, (USD Million)
TABLE 20	Other propellants market demand estimates and forecast, 2012-2020, (Kilo Tons) (USD Million)
TABLE 21	Other propellants market volume estimates and forecast, by region, 2012-2020, (Kilo Tons)
TABLE 22	Other propellants market revenue estimates and forecast, by region, 2012-2020, (USD Million)
TABLE 23	Aerosol propellants market demand estimates and forecast in personal care, 2012-2020, (Kilo Tons) (USD Million)
TABLE 24	Aerosol propellants market volume in personal care, by region, 2012-2020, (Kilo Tons)
TABLE 25	Aerosol propellant market revenue in personal care, by region, 2012-2020, (USD Million)
TABLE 26	Aerosol propellants market demand estimates and forecast from household, 2012-2020, (Kilo Tons) (USD Million)
TABLE 27	Aerosol propellants market volume in household, by region, 2012-2020, (Kilo Tons)
TABLE 28	Aerosol propellants market revenue in household, by region, 2012-2020, (USD Million)
TABLE 29	Aerosol propellants market demand estimates and forecast in automotive & industrial, 2012-2020, (Kilo Tons) (USD Million
TABLE 30	Aerosol propellants market volume in automotive & industrial, by region, 2012-2020, (Kilo Tons)
TABLE 31	Aerosol propellants market revenue in automotive, by region, 2012-2020, (USD Million)
TABLE 32	Aerosol propellants market demand estimates and forecast in foods, 2012-2020, (Kilo Tons) (USD Million)
TABLE 33	Aerosol propellants market volume in foods, by region, 2012-2020, (Kilo Tons)
TABLE 34	Aerosol propellants market revenue in foods, by region, 2012-2020, (USD Million)
TABLE 35	Aerosol propellants market demand estimates and forecast from paints, 2012-2020, (Kilo Tons) (USD Million)
TABLE 36	Aerosol propellants market volume in paints, by region, 2012-2020, (Kilo Tons)
TABLE 37	Aerosol propellants market revenue in paints, by region, 2012-2020, (USD Million)
TABLE 38	Aerosol propellants market demand estimates and forecast in medical, 2012-2020, (Kilo Tons) (USD Million)
TABLE 39	Aerosol propellants market volume in medical, by region, 2012-2020, (Kilo Tons)
TABLE 40	Aerosol propellants market revenue in medical, by region, 2012-2020, (USD Million)
TABLE 41	Aerosol propellants market demand estimates and forecast in other applications, 2012-2020, (Kilo Tons) (USD Million)
TABLE 42	Aerosol propellants market volume in other applications, by region, 2012-2020, (Kilo Tons)
TABLE 43	Aerosol propellants market revenue from other applications, by region, 2012-2020, (USD Million)
TABLE 44	North America aerosol propellants market estimates and forecast, 2012-2020 (Kilo Tons) (USD Million)
TABLE 45	North America aerosol propellants market volume, by product, 2012 – 2020, (Kilo Tons)
TABLE 46	North America aerosol propellants market revenue, by product, 2012 – 2020, (USD Million)
TABLE 47	North America aerosol propellants market volume, by application, 2012 – 2020 (Kilo Tons)
TABLE 48	North America aerosol propellants market revenue, by application, 2012 – 2020 (USD Million)
TABLE 49	Latin America aerosol propellants market estimates and forecast, 2012-2020,(Kilo Tons) (USD Million)
TABLE 50	Latin America aerosol propellants market volume, by product, 2012 – 2020, (Kilo Tons)
TABLE 51	Latin America aerosol propellants market revenue, by product, 2012 – 2020, (USD Million)
TABLE 52	Latin America aerosol propellants market volume, by application, 2012 – 2020 (Kilo Tons)
TABLE 53	Latin America aerosol propellants market revenue, by application, 2012 – 2020 (USD Million)
TABLE 54	Europe aerosol propellants market estimates and forecast, 2012-2020,(Kilo Tons) (USD Million)
TABLE 55	Europe aerosol propellants market volume, by product, 2012 – 2020, (Kilo Tons)
TABLE 56	Europe aerosol propellants market revenue, by product, 2012 – 2020, (USD Million)
TABLE 57	Europe aerosol propellants market volume, by application, 2012 – 2020 (Kilo Tons)
TABLE 58	Europe aerosol propellants market revenue, by application, 2012 – 2020 (USD Million)
TABLE 59	Asia Pacific aerosol propellants market estimates and forecast, 2012-2020,(Kilo Tons) (USD Million)
TABLE 60	Asia Pacific aerosol propellants market volume, by product, 2012 – 2020, (Kilo Tons)
TABLE 61	Asia Pacific aerosol propellants market revenue, by product, 2012 – 2020, (USD Million)
TABLE 62	Asia Pacific aerosol propellants market volume, by application, 2012 – 2020 (Kilo Tons)
TABLE 63	Asia Pacific aerosol propellants market revenue, by application, 2012 – 2020 (USD Million)
TABLE 64	MEA aerosol propellants market estimates and forecast, 2012-2020,(Kilo Tons) (USD Million)
TABLE 65	MEA aerosol propellants market volume, by product, 2012 – 2020, (Kilo Tons)
TABLE 66	MEA aerosol propellants market revenue, by product, 2012 – 2020, (USD Million)
TABLE 67	MEA aerosol propellants market volume, by application, 2012 – 2020 (Kilo Tons)
TABLE 68	MEA aerosol propellants market revenue, by application, 2012 – 2020 (USD Million)

Speak to the report author to design an exclusive study to serve your research needs.
Your personal and confidential information is safe and secure.

