Toll Free: 1-888-928-9744
Toll Free: 1-888-928-9744

Published: Oct, 2015 | Pages:
118 | Publisher: Radiant Insights Inc.
Industry: Materials | Report Format: Electronic (PDF)
Industry Overview Global advanced energy storage systems market size is expected to reach 11.3 GW by 2022, growing at a CAGR of 15.0% from 2014 to 2022. Increasing electricity usage coupled with energy supply deficit for applications such as residential, commercial and industrial is expected to drive the demand. This includes technologies that use energy more productively, reduce environmental costs and diversify energy sources. They consist of newer technologies which help in driving economy powered by affordable, secure and clean energy. Cost cuts coupled with improved reliability are key characteristics of advanced energy storage systems and are expected to favor advanced energy storage systems market growth. The indsutry was driven by high revenue generated by transportation, building efficiency segments and electricity generation. Electricity generation was the largest advanced energy storage systems market segment as of 2014 accounting for over 33.5% of the total demand. Transportation was the second largest segment worldwide at USD 372.66 billion in 2014. The segment witnessed growth in the past four years of over 11% since 2011. Hybrid and plug-in electric vehicles led the segment in the past few years whereas clean diesel vehicles dominated the transportation advanced energy segment. Growth in electric vehicle market is expected owing to large-scale adoption of alternative fuel vehicle technologies as a solution to both environmental and energy security issues. Major automobile manufacturers including Ford Motors, GM, Nissan, Toyota, Honda, Mercedes-Benz and Tesla are major participants. Stringent government regulations owing to curb green house gases (GNG) are expected to act in favor of demand growth. Regulatory bodies such as U.S. Environmental Protection Energy (EPA) and Department of Energy (DOE) have imposed norms on using these systems. For Example, The U.S. EPA has established a draft regulating GHG emission from power plants under section 111(d) of Clean Air Act wherein advanced energy storage system prove to be a critical asset. High capital cost as a result of high technology cost is likely to be a primary barrier for advanced energy storage systems deployment globally. Investments in research to develop cost cutting technology are expected to provide key opportunities for companies.U.S. advanced energy storage systems market, by technology, 2012-2022 (MW)Technology Overview Thermal energy storage system was the leading technology with valuation of over USD 1.3 billion in 2014. Reduced power consumption, improved efficiency and lower CO2 emissions make thermal technology ideally suited for installation in several applications. Thermal segment includes energy storage technologies such as pumped heat electrical storage, hydrogen energy storage and liquid air energy storage. Batteries energy storage was the second largest technology and accounted for more than 10% of the overall share in 2014. This technology is expected to witness higher growth rates ease in charging and re-energization of liquid electrolyte which results in low wastage. Flywheel energy storage technology is expected to witness high growth rates of above 18% from 2015 to 2020. Factors associated with flywheel such as frequency regulation, better electricity quality and instant response are likely to influence its growth over the forecast period. Regional Overview North America was the leading regional market with a valuation exceeding USD 850 million in 2014. Favorable government regulations regarding to curb carbon emissions in U.S. are expected to drive North America’s growth. Europe was the second largest regional indsutry and accounted for more than 15% of the total demand in 2014. Presence of renewable installations in Europe according to International Renewable Energy Agency is expected to provide impetus for advanced energy storage systems market growth over the forecast period. Increasing priority given to electric vehicles in countries including Germany, France is expected to drive demand. Asia Pacific advanced energy storage systems market is expected to be the fastest growing region, at an estimated CAGR of more than 15%. Rising industrialization coupled with enhanced consumer lifestyle in India and China is expected to propel growth. The developing economies of this region have been upgrading their energy infrastructure to meet rising demand for power and taking measures to control energy future consumption Competitive Market Share Advanced energy storage systems market share is highly fragmented with presence of companies offering technologies in various areas. The industry is also characterized by continuous research and joint ventures to develop technologies for different application scope. Li-Ti batteries are developed by Atlair Nanotechnologies with a view to resolve problems relating for frequency regulation. Key companies involved include Alevo, AES energy Storage, GE and LG Chem. Other prominent companies include ZBB systems, Active Power, Inc., Electrovaya Inc., Enersys, Nippon Chemi-Con Corporation and Samsung SDI Co. Ltd.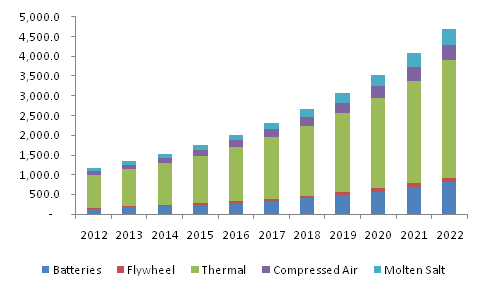
 Table Of Content

Chapter 1	Research Methodology
1.1	Research Methodology
1.2	Research Scope & Assumptions
1.3	List of Data Sources

Chapter 2	Executive Summary
2.1	Advanced Energy Storage System – Industry Summary & Key Buying Criteria, 2012 - 2022

Chapter 3	Advanced Energy Storage Systems Industry Overview
3.1	Advanced energy storage systems market segmentation
3.2	Advanced energy storage systems market size and growth prospects, 2012 - 2022
3.3	Advanced energy storage systems value chain analysis
3.3.1	Vendor landscape
3.4	Technology overview
3.4.1	Batteries
3.4.2	Flywheel
3.4.3	Molten Salt
3.4.4	Compressed Air
3.4.5	Thermal
3.4.6	Upcoming technologies
3.4.6.1	Hydrogen-storage devices
3.4.6.2	Superconducting Magnetic Energy Storage
3.4.6.3	Synthetic Gas
3.5	Installed capacities worldwide, by technology, 2014
3.5.1	Battery technology
3.5.2	Flywheel Technology
3.5.3	Thermal Technology
3.5.4	Compressed Air Technology
3.5.5	Molten Salt Technology
3.6	Regulatory framework
3.7	Advanced energy storage systems market dynamics
3.7.1	Market driver analysis
3.7.1.1	Increasing advanced energy demand
3.7.1.2	Favorable regulatory scenario
3.7.1.3	Positive electric vehicle market outlook
3.7.2	Market restraints analysis
3.7.2.1	High capital costs
3.8	Advanced energy storage systems - Key opportunities prioritized
3.9	Advanced energy storage systems Porter’s analysis
3.10	Advanced energy storage systems PESTEL analysis

Chapter 4	Advanced Energy Storage Systems Technology Overview
4.1	Advanced energy storage systems market share by technology, 2014 & 2022
4.2	Batteries
4.2.1	Global advanced energy storage systems market in battery technology, 2012-2022, (MW) (USD Million)
4.2.2	Global advanced energy storage systems market in battery technology, by region, 2012-2022, (MW) (USD Million)
4.3	Flywheel
4.3.1	Global advanced energy storage systems market in flywheel technology, 2012-2022, (MW) (USD Million)
4.3.2	Global advanced energy storage systems market in flywheel technology, by region, 2012-2022, (MW) (USD Million)
4.4	Thermal
4.4.1	Global advanced energy storage systems market in thermal technology, 2012-2022, (MW) (USD Million)
4.4.2	Global advanced energy storage systems market in thermal technology, by region, 2012-2022, (MW) (USD Million)
4.5	Compressed Air
4.5.1	Global advanced energy storage systems market in compressed air technology, 2012-2022, (MW) (USD Million)
4.5.2	Global advanced energy storage systems market in compressed air technology, by region, 2012-2022, (MW) (USD Million)
4.6	Molten Salt
4.6.1	Global advanced energy storage systems market in molten salt, 2012-2022, (MW) (USD Million)
4.6.2	Global advanced energy storage systems market in molten salt, by region, 2012-2022, (MW) (USD Million)

Chapter 5	Advanced Energy Storage Systems Regional Overview
5.1	Advanced energy storage systems market share by region, 2014 & 2022
5.2	North America
5.2.1	North America advanced energy storage systems market estimates and forecast, 2012-2022, (MW) (USD Million)
5.2.2	North America advanced energy storage systems market estimates and forecast, by technology, 2012-2022, (MW) (USD Million)
5.2.3	U.S.
5.2.3.1	U.S. advanced energy storage systems market estimates and forecast, 2012-2022, (MW) (USD Million)
5.2.3.2	U.S. advanced energy storage systems market estimates and forecast, by technology, 2012-2022, (MW) (USD Million)
5.3	Europe
5.3.1	Europe advanced energy storage systems market estimates and forecast, 2012-2022, (MW) (USD Million)
5.3.2	Europe advanced energy storage systems market estimates and forecast, by technology, 2012-2022, (MW) (USD Million)
5.3.3	Germany
5.3.3.1	Germany advanced energy storage systems market estimates and forecast, 2012-2022, (MW) (USD Million)
5.3.3.2	Germany advanced energy storage systems market estimates and forecast, by technology, 2012-2022, (MW) (USD Million)
5.3.4	UK
5.3.4.1	UK advanced energy storage systems market estimates and forecast, 2012-2022, (MW) (USD Million)
5.3.4.2	UK advanced energy storage systems market estimates and forecast, by technology, 2012-2022, (MW) (USD Million)
5.4	Asia Pacific
5.4.1	Asia Pacific advanced energy storage systems market estimates and forecast, 2012-2022, (MW) (USD Million)
5.4.2	Asia Pacific advanced energy storage systems market estimates and forecast, by technology, 2012-2020
5.4.2.1	Asia Pacific advanced energy storage systems market capacity, by technology, 2012 – 2022, (MW)
5.4.3	China
5.4.3.1	China advanced energy storage systems market estimates and forecast, 2012-2022, (MW) (USD Million)
5.4.3.2	China advanced energy storage systems market estimates and forecast, by technology, 2012-2020
5.4.4	India
5.4.4.1	India advanced energy storage systems market estimates and forecast, 2012-2022, (MW) (USD Million)
5.4.4.2	India advanced energy storage systems market estimates and forecast, by technology, 2012-2020
5.4.5	Japan
5.4.5.1	Japan advanced energy storage systems market estimates and forecast, 2012-2022, (MW) (USD Million)
5.4.5.2	Japan advanced energy storage systems market estimates and forecast, by technology, 2012-2020
5.5	Latin America
5.5.1	Latin America advanced energy storage systems market estimates and forecast, 2012-2022, (MW) (USD Million)
5.5.2	Latin America advanced energy storage systems market estimates and forecast, by technology, 2012-2022
5.5.3	Brazil
5.5.3.1	Brazil advanced energy storage systems market estimates and forecast, 2012-2022, (MW) (USD Million)
5.5.3.2	Brazil advanced energy storage systems market estimates and forecast, by technology, 2012-2022
5.6	MEA
5.6.1	MEA advanced energy storage systems market estimates and forecast, 2012-2022, (MW) (USD Million)
5.6.2	MEA advanced energy storage systems market estimates and forecast, by technology, 2012-2022
5.6.3	Saudi Arabia
5.6.3.1	Saudi Arabia advanced energy storage systems market estimates and forecast, 2012-2022, (MW) (USD Million)
5.6.3.2	Saudi Arabia advanced energy storage systems market estimates and forecast, by technology, 2012-2022

Chapter 6	Competitive Landscape
6.1	Hitachi
6.1.1	Company Overview
6.1.2	Financial Performance
6.1.3	Product Benchmarking
6.1.4	Strategic Initiatives
6.2	AES Energy
6.2.1	Company Overview
6.2.2	Financial Performance
6.2.3	Product Benchmarking
6.2.4	Strategic Initiatives
6.3	Alevo
6.3.1	Company Overview
6.3.2	Financial Performance
6.3.3	Product Benchmarking
6.3.4	Strategic Initiatives
6.4	ZBB Energy
6.4.1	Company Overview
6.4.2	Financial Performance
6.4.3	Product Benchmarking
6.4.4	Strategic Initiatives
6.5	Exide Technologies
6.5.1	Company Overview
6.5.2	Financial Performance
6.5.3	Product Benchmarking
6.5.4	Strategic Initiatives
6.6	LG Chem Ltd.
6.6.1	Company Overview
6.6.2	Financial Performance
6.6.3	Product Benchmarking
6.6.4	Strategic Initiatives
6.7	Maxwell Technologies Inc.
6.7.1	Company Overview
6.7.2	Financial Performance
6.7.3	Product Benchmarking
6.7.4	Strategic Initiatives
6.8	Nippon Chemi-Con Corporation
6.8.1	Company Overview
6.8.2	Financial Performance
6.8.3	Product Benchmarking
6.8.4	Strategic Initiatives
6.9	SAFT
6.9.1	Company Overview
6.9.2	Financial Performance
6.9.3	Product Benchmarking
6.9.4	Strategic Initiatives
6.10	Aquion Energy
6.10.1	Company Overview
6.10.2	Financial Performance
6.10.3	Product Benchmarking
6.10.4	Strategic Initiatives
6.11	Altair Nanotechnologies Inc.
6.11.1	Company Overview
6.11.2	Financial Performance
6.11.3	Product Benchmarking
6.12	Enersys
6.12.1	Company Overview
6.12.2	Financial Performance
6.12.3	Product Benchmarking
6.12.4	Strategic Initiatives
6.13	Active Power Inc.
6.13.1	Company Overview
6.13.2	Financial Performance
6.13.3	Product Benchmarking
6.13.4	Strategic Initiatives
6.14	Toshiba
6.14.1	Company Overview
6.14.2	Financial Performance
6.14.3	Product Benchmarking
6.15	Greensmith
6.15.1	Company Overview
6.15.2	Financial Performance
6.15.3	Product Benchmarking
6.15.4	Strategic Initiatives
6.16	A123 Systems, LLC.
6.16.1	Company Overview
6.16.2	Financial Performance
6.16.3	Product Benchmarking
6.16.4	Strategic Initiatives
6.17	China BAK Battery, Inc.
6.17.1	Company Overview
6.17.2	Financial Performance
6.17.3	Product Benchmarking
6.17.4	Strategic Initiatives
6.18	Electrovaya Inc.
6.18.1	Company Overview
6.18.2	Financial Performance
6.18.3	Product Benchmarking
6.18.4	Strategic Initiatives
6.19	Energizer Holdings Inc.
6.19.1	Company Overview
6.19.2	Financial Performance
6.19.3	Product Benchmarking
6.19.4	Strategic initiatives
6.20	Kokam Co. Ltd.
6.20.1	Company Overview
6.20.2	Financial Performance
6.20.3	Product Benchmarking
6.20.4	Strategic Initiatives
6.21	Alstom
6.21.1	Company Overview
6.21.2	Financial Performance
6.21.3	Product Benchmarking
6.21.4	Strategic Initiatives
6.22	Ecoult
6.22.1	Company Overview
6.22.2	Financial Performance
6.22.3	Product Benchmarking
6.22.4	Strategic Initiatives
6.23	Duke Energy
6.23.1	Company Overview
6.23.2	Financial Performance
6.23.3	Product Benchmarking
6.23.4	Strategic Initiatives
6.24	Samsung SDI
6.24.1	Company Overview
6.24.2	Financial Performance
6.24.3	Product Benchmarking
6.24.4	Strategic Initiatives
6.25	The Furukawa Battery Co., Ltd.
6.25.1	Company Overview
6.25.2	Financial Performance
6.25.3	Product Benchmarking
6.25.4	Strategic Initiatives
6.26	GE Energy Storage
6.26.1	Company Overview
6.26.2	Financial Performance
6.26.3	Product Benchmarking
6.26.4	Strategic Initiatives
List of Tables

TABLE 1	Advanced Energy Storage System – Industry Summary & Key Buying Criteria, 2012 - 2022
TABLE 2	Global advanced energy storage system estimates and forecast, 2015 – 2022, (MW) (USD Million)
TABLE 3	Global advanced energy storage system market capacity, by region, 2012-2022 (MW)
TABLE 4	Global advanced energy storage system market revenue, by region, 2012 – 2022 (USD Million)
TABLE 5	Global advanced energy storage system market capacity, by technology, 2012 – 2022 (MW)
TABLE 6	Global advanced energy storage system market revenue, by technology, 2012 – 2022 (USD Million)
TABLE 7	Vendor landscape
TABLE 8	Advanced energy storage systems market – Key market driver analysis
TABLE 9	Advanced energy storage systems – Key market restraint analysis
TABLE 10	Total energy storage costs, by technology (USD/KW)
TABLE 11	Global advanced energy storage systems market in battery technology 2012-2022, (MW) (USD Million)
TABLE 12	Global advanced energy storage systems market in battery technology, by region, 2012-2022, (MW)
TABLE 13	Global advanced energy storage systems market revenue in battery technology, by region, 2012-2022, (USD Million)
TABLE 14	Global advanced energy storage systems market in flywheel technology, 2012-2022, (MW) (USD Million)
TABLE 15	Global advanced energy storage systems market in flywheel technology, by region, 2012-2022, (MW)
TABLE 16	Global advanced energy storage systems market revenue in flywheel technology, by region, 2012-2022, (USD Million)
TABLE 17	Global advanced energy storage systems market in thermal technology, 2012-2022, (MW) (USD Million)
TABLE 18	Global advanced energy storage systems market in thermal technology, by region, 2012-2022, (MW)
TABLE 19	Global advanced energy storage systems market revenue in thermal technology, by region, 2012-2022, (USD Million)
TABLE 20	Global advanced energy storage systems market in compressed air technology, 2012-2022, (MW) (USD Million)
TABLE 21	Global advanced energy storage systems market in compressed air technology, by region, 2012-2022, (MW)
TABLE 22	Global advanced energy storage systems market revenue in compressed air technology, by region, 2012-2022, (USD Million)
TABLE 23	Global advanced energy storage systems market in molten salt, 2012-2022, (MW) (USD Million)
TABLE 24	Global advanced energy storage systems market in molten salt technology, by region, 2012-2022, (MW)
TABLE 25	Global advanced energy storage systems market revenue in molten salt technology, by region, 2012-2022, (USD Million)
TABLE 26	North America advanced energy storage systems market capacity and revenue, 2012 – 2022, (MW) (USD Million)
TABLE 27	North America advanced energy storage systems market capacity, by technology, 2012-2022, (MW)
TABLE 28	North America advanced energy storage systems market revenue, by technology, 2012-2022, (USD Million)
TABLE 29	U.S. advanced energy storage systems market capacity and revenue, 2012 – 2022, (MW) (USD Million)
TABLE 30	U.S. advanced energy storage systems market capacity, by technology, 2012-2022, (MW)
TABLE 31	U.S. advanced energy storage systems market revenue, by technology, 2012-2022, (USD Million)
TABLE 32	Europe advanced energy storage systems market capacity and revenue, 2012 – 2022, (MW) (USD Million)
TABLE 33	Europe advanced energy storage systems market capacity, by technology, 2012-2022, (MW)
TABLE 34	Europe advanced energy storage systems market revenue, by technology, 2012-2022, (USD Million)
TABLE 35	Germany advanced energy storage systems market capacity and revenue, 2012 – 2022, (MW) (USD Million)
TABLE 36	Germany advanced energy storage systems market capacity, by technology, 2012-2022, (MW)
TABLE 37	Germany advanced energy storage systems market revenue, by technology, 2012-2022, (USD Million)
TABLE 38	UK advanced energy storage systems market capacity and revenue, 2012 – 2022, (MW) (USD Million)
TABLE 39	UK advanced energy storage systems market capacity, by technology, 2012-2022, (MW)
TABLE 40	UK advanced energy storage systems market revenue, by technology, 2012-2022, (USD Million)
TABLE 41	Asia Pacific advanced energy storage systems market capacity and revenue, 2012 – 2022, (MW) (USD Million)
TABLE 42	Asia Pacific advanced energy storage systems market revenue, by technology, 2012 – 2022, (USD Million)
TABLE 43	China advanced energy storage systems market capacity and revenue, 2012 – 2022, (MW) (USD Million)
TABLE 44	China advanced energy storage systems market capacity, by technology, 2012 – 2022, (MW)
TABLE 45	China advanced energy storage systems market revenue, by technology, 2012 – 2022, (USD Million)
TABLE 46	India advanced energy storage systems market capacity and revenue, 2012 – 2022, (MW) (USD Million)
TABLE 47	India advanced energy storage systems market capacity, by technology, 2012 – 2022, (MW)
TABLE 48	India advanced energy storage systems market revenue, by technology, 2012 – 2022, (USD Million)
TABLE 49	Japan advanced energy storage systems market capacity and revenue, 2012 – 2022, (MW) (USD Million)
TABLE 50	Japan advanced energy storage systems market capacity, by technology, 2012 – 2022, (MW)
TABLE 51	Japan advanced energy storage systems market revenue, by technology, 2012 – 2022, (USD Million)
TABLE 52	Latin America advanced energy storage systems market capacity and revenue, 2012 – 2022, (MW) (USD Million)
TABLE 53	Latin America advanced energy storage systems market capacity, by technology, 2012 – 2022, (MW)
TABLE 54	Latin America advanced energy storage systems market revenue, by technology, 2012 – 2022, (USD Million)
TABLE 55	Brazil advanced energy storage systems market capacity and revenue, 2012 – 2022, (MW) (USD Million)
TABLE 56	Brazil advanced energy storage systems market capacity, by technology, 2012 – 2022, (MW)
TABLE 57	Brazil advanced energy storage systems market revenue, by technology, 2012 – 2022, (USD Million)
TABLE 58	MEA advanced energy storage systems market capacity and revenue, 2012 – 2022, (MW) (USD Million)
TABLE 59	MEA advanced energy storage systems market capacity, by technology, 2012 – 2022, (MW)
TABLE 60	MEA advanced energy storage systems market revenue, by technology, 2012 – 2022, (USD Million)
TABLE 61	Saudi Arabia advanced energy storage systems market capacity and revenue, 2012 – 2022, (MW) (USD Million)
TABLE 62	Saudi Arabia advanced energy storage systems market capacity, by technology, 2012 – 2022, (MW)
TABLE 63	Saudi Arabia advanced energy storage systems market revenue, by technology, 2012 – 2022, (USD Million)

Speak to the report author to design an exclusive study to serve your research needs.
Your personal and confidential information is safe and secure.

