Toll Free: 1-888-928-9744
Toll Free: 1-888-928-9744

Published: Oct, 2015 | Pages:
96 | Publisher: Radiant Insights Inc.
Industry: Materials | Report Format: Electronic (PDF)
The Report Contains Activated Carbon Market Size By Application (Liquid Phase, Gas Phase), By Product (Granular Activated Carbon (GAC), Powdered Activated Carbon (PAC)), By End-use (Food & Beverages, Water Treatment, Air Purification , Pharmaceutical & Medical, Automotive) Competitive Analysis & Forecast, 2012 – 2020 Industry Overview Global activated carbon market size is expected to reach 2.96 million tons by 2020, growing at a CAGR of 11.7% from 2014 to 2020. Increase in water and waste water treatment units is anticipated to drive activated carbon market growth over the forecast period. Increasing water prices and regulatory pressure to recycle are expected to benefit the overall growth. The escalating use of water for industrial processes has spurred the need for water and wastewater treatments, boosting water and wastewater treatment processes demand. Activated carbon price grew steadily up to 2012, while seeing high growth in 2013, set to continue over the forecast period. Growing air filtration demand across the last decade is expected to benefit activated carbon market growth. Air filtration revenue in 2010 was over USD 6,300 million and reached over USD 7,000 million in 2013. Fast growing industries in emerging markets such as China, India, Mexico, Brazil, South East Asia, and Russia have compelled several industrial plants to incorporate their own water treatment facilities. For the past decade, China reported a surge in industrialization and urbanization. This led to direct increase in volume of treated waste water. With Central Government’s financial programs, China has invested over USD 4.5 billion in improving the clean water supply. In 2012, the volume of treated waste water was 114,640 kilo tons. Favorable regulatory norms, such as Clean Air Mercury Rule, from the U.S. Environmental Protection Agency (EPA), to reduce mercury emissions from coal-fired power plants are expected to favor activated carbon demand in air filtration. These activated carbons are said to be more effective than any other compounds and help to reduce the foul-smelling compounds’ emission too. This factor is anticipated to increase demand for this product in indoor air regulatory systems. Scarcity in raw materials which include coconut shell, coal and wood pulp driven by increasing demand is likely to result in higher prices quoted by the major raw material suppliers. This factor is anticipated to hamper profitability.North America activated carbon market size, by product, 2012-2020 (Kilo Tons)Product Overview Powdered activated carbon (PAC) was largely consumed with an estimated revenue generation of over USD 1.1 billion in 2013. Increasing application in cement industry coupled with regulatory norms from EPA Mercury & Air Toxic Standard for mercury control standards is anticipated to drive powdered products demand. Granular products (GAC) accounted for over 35% of the total volume in 2013 and are likely to witness moderate gains at an estimated CAGR of over 10% up to 2020. Factors such as better surface area, size balance and hydraulic head make it widely preferred in end-use industries. Their application includes gas & vapor absorption and deodorization & components separation in flow system. Application Overview Liquid phase was the dominant application with a market valuation of approximately USD 1.13 billion in 2013. Activated carbon is widely used in removing trace contaminants in ground water. Increasing awareness towards health concerns arising from water contamination is anticipated to drive demand. Gas phase application accounted for more than 45% of the total volume in 2013. It is anticipated to witness highest gains of over 12% up to 2020 owing to increasing application scope in end-use industries such as food & beverage and chemical. It is majorly used in these aforementioned industries for ozone conversion to oxygen from catalytic reaction and deodorization. End-use Overview Water treatment was the leading end-use segment for activated carbon marker with revenue generation estimated at over USD 900 million in 2013. Standards mandating companies to adopt environment friendly and efficient water disposal techniques are presumed to further aid demand. Air purification accounted for more than 35% of the total volume in 2013 and is likely to gain significant growth rates of over 13% up to 2020. Growing demand from both domestic and commercial applications can be attributed to rising demand for air-conditioners and air-filters. Growing health concerns regarding respiratory diseases and rising awareness are other key factors capable of positively influencing the activated carbon industry. Regional Overview Asia Pacific activated carbon market was the dominant region with revenue generation estimated at over USD 700 million in 2013. Growing automobile demand, rising population, increasing disposable income and government initiatives to reduce industrial impact on the environment are likely to favor growth in this region. Economies such as China, India and Japan are presumed to lead the regional demand. Europe activated carbon industry accounted for over 15% of the global volume in 2013 and is anticipated to witness gains of over 10% from 2014 to 2020. Growing government norms to curb pollution coupled with growth in water treatment industry in Germany and UK is anticipated to support activated carbon demand. Competitive Market Share The global activated carbon market share is highly concentrated and the top three business players accounted for over 70% of the total revenue in 2013. Calgon Carbon Corporation dominated the industry accounted for over 25% of the total demand. Key companies include Cabot Corporation, MeadWestvaco Corporation, Haycarb PLC, Kureha Corp, ADA-ES Inc., Carbon Resources LLC and Kuraray Co. Other prominent companies include Siemens Water Technologies, Jacobi Carbons and Calrimex Group.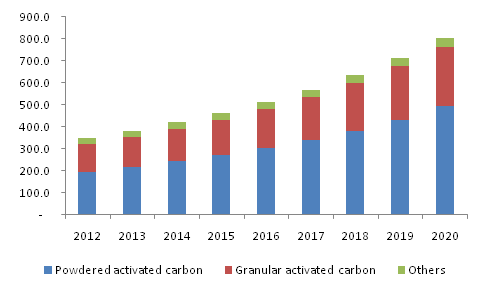
 Table of Content

Chapter 1	Methodology and Scope
1.1	Research methodology
1.2	Research scope and assumptions
1.3	List of data sources

Chapter 2	Executive Summary
2.1	Activated Carbon - Industry Summary & Key Buying Criteria, 2012 - 2020

Chapter 3	Activated Carbon Industry Overview
3.1	Market segmentation
3.2	Market size and growth prospects, 2012 - 2020
3.3	Activated carbon value chain analysis
3.4	Activated carbon market dynamics
3.4.1	Market driver analysis
3.4.1.1	Growing demand for water treatment processes
3.4.1.2	Growth of global air filtration industry
3.4.2	Market restraint analysis
3.4.2.1	Scarcity of raw material causing price hikes
3.5	Key opportunities - Prioritized
3.6	Industry analysis - Porter’s
3.7	Activated carbon company market share analysis, 2013
3.8	Activated carbon PESTEL analysis

Chapter 4	Activated Carbon Product Overview
4.1	Global activated carbon market volume share by product, 2013 & 2020
4.2	Powdered activated carbon
4.2.1	Market estimates and forecast, 2012-2020
4.2.2	Market estimates and forecast by region, 2012-2020
4.3	Granular activated carbon
4.3.1	Market estimates and forecast, 2012-2020
4.3.2	Market estimates and forecast by region, 2012 to 2020
4.4	Other
4.4.1	Market estimates and forecast, 2012-2020
4.4.2	Market estimates and forecast by region, 2012 to 2020

Chapter 5	Activated Carbon Application Overview
5.1	Global activated carbon market volume share by application, 2013 & 2020
5.2	Liquid phase
5.2.1	Market estimates and forecast from liquid phase, 2012-2020
5.2.2	Market estimates and forecast from liquid phase by region, 2012-2020
5.3	Gas phase
5.3.1	Market estimates and forecast from gas phase, 2012-2020
5.3.2	Market estimates and forecast from gas phase by region, 2012-2020

Chapter 6	Activated Carbon End-Use Overview
6.1	Global activated carbon market volume share by end-use, 2013 & 2020
6.2	Water treatment
6.2.1	Market estimates and forecast, 2012-2020
6.2.2	Market estimates and forecast by region, 2012-2020
6.3	Food & beverage processing
6.3.1	Market estimates and forecast, 2012-2020
6.3.2	Market estimates and forecast by region, 2012-2020
6.4	Pharmaceutical & medical
6.4.1	Market estimates and forecast, 2012-2020
6.4.2	Market estimates and forecast by region, 2012-2020
6.5	Automotive
6.5.1	Market estimates and forecast, 2012-2020
6.5.2	Market estimates and forecast by region, 2012-2020
6.6	Air purification
6.6.1	Market estimates and forecast, 2012-2020
6.6.2	Market estimates and forecast by region, 2012-2020
6.7	Other
6.7.1	Market estimates and forecast, 2012-2020
6.7.2	Market estimates and forecast by region, 2012-2020

Chapter 7	Activated Carbon Regional Overview
7.1	Global activated carbon market volume share by region, 2013 & 2020
7.2	North America
7.2.1	Market estimates and forecast, 2012 – 2020
7.2.2	Market estimates and forecast by product, 2012 – 2020
7.2.3	Market estimates and forecast by application, 2012 – 2020
7.2.4	Market estimates and forecast by end-use, 2012 – 2020
7.3	Europe
7.3.1	Market estimates and forecast, 2012 – 2020
7.3.2	Market estimates and forecast by product, 2012 – 2020
7.3.3	Market estimates and forecast by application, 2012 – 2020
7.3.4	Market estimates and forecast by end-use, 2012 – 2020
7.4	Asia Pacific
7.4.1	Market estimates and forecast, 2012 – 2020
7.4.2	Market estimates and forecast by product, 2012 – 2020
7.4.3	Market estimates and forecast by application, 2012 – 2020
7.4.4	Market estimates and forecast by end-use, 2012 – 2020
7.5	RoW
7.5.1	Market estimates and forecast, 2012 – 2020
7.5.2	Market estimates and forecast by product, 2012 – 2020
7.5.3	Market estimates and forecast by application, 2012 – 2020
7.5.4	Market estimates and forecast by end-use, 2012 – 2020

Chapter 8	Competitive Landscape
8.1	ADA-ES, Inc.
8.1.1	Company Overview
8.1.2	Financial Performance
8.1.3	Product Benchmarking
8.1.4	Strategic Initiatives
8.2	Cabot Norit Corporation
8.2.1	Company Overview
8.2.2	Financial Performance
8.2.3	Product Benchmarking
8.2.4	Strategic Initiatives
8.3	Calgon Carbon Corporation
8.3.1	Company Overview
8.3.2	Financial Performance
8.3.3	Product Benchmarking
8.3.4	Strategic Initiatives
8.4	CarboTech AC GmbH
8.4.1	Company Overview
8.4.2	Financial Performance
8.4.3	Product Benchmarking
8.5	CECA
8.5.1	Company Overview
8.5.2	Financial Performance
8.5.3	Product Benchmarking
8.6	Donau Chemie Group
8.6.1	Company Overview
8.6.2	Financial Performance
8.6.3	Product Benchmarking
8.7	Haycarb
8.7.1	Company Overview
8.7.2	Financial Performance
8.7.3	Product Benchmarking
8.7.4	Strategic Initiatives
8.8	Jacobi Carbons AB
8.8.1	Company Overview
8.8.2	Financial Performance
8.8.3	Product Benchmarking
8.8.4	Strategic Initiatives
8.9	Kuraray Co., Ltd.
8.9.1	Company Overview
8.9.2	Financial Performance
8.9.3	Product Benchmarking
8.9.4	Strategic Initiatives
8.10	Kureha Corporation
8.10.1	Company overview
8.10.2	Financial Performance
8.10.3	Product Benchmarking
8.10.4	Strategic Initiatives
8.11	MeadWestvaco (MWV) Corporation
8.11.1	Company Overview
8.11.2	Financial Performance
8.11.3	Product Benchmarking
8.11.4	Strategic Initiatives
8.12	Osaka Gas Chemicals Co., Ltd.
8.12.1	Company Overview
8.12.2	Financial Performance
8.12.3	Product Benchmarking
8.12.4	Strategic Initiatives
8.13	Oxbow Activated Carbon LLC
8.13.1	Company Overview
8.13.2	Financial Performance
8.13.3	Product Benchmarking
8.13.4	Strategic Initiatives
8.14	Siemens Water Technologies Corporation
8.14.1	Company Overview
8.14.2	Financial Performance
8.14.3	Product Benchmarking
8.14.4	Strategic Initiatives
8.15	Veolia Water Solutions and Technologies Pvt. Ltd.
8.15.1	Company Overview
8.15.2	Financial Performance
8.15.3	Product Benchmarking
8.15.4	Strategic Initiatives
List of Tables

TABLE 1	Activated Carbon - Industry Summary & Key Buying Criteria
TABLE 2	Global activated carbon market estimates and forecast, 2012 – 2020, (Kilo Tons) (USD million)
TABLE 3	Global activated carbon market estimates and forecast, by region, 2012 – 2020, (Kilo Tons)
TABLE 4	Global activated carbon market estimates and forecast, by region, 2012 – 2020, (USD million)
TABLE 5	Global activated carbon market estimates and forecast, by product, 2012 – 2020, (Kilo Tons)
TABLE 6	Global activated carbon market estimates and forecast, by product, 2012 – 2020, (USD Million)
TABLE 7	Global activated carbon market estimates and forecast, by application, 2012 – 2020, (Kilo Tons)
TABLE 8	Global activated carbon market estimates and forecast, by application, 2012 – 2020, (USD Million)
TABLE 9	Global activated carbon market estimates and forecast, by end-use, 2012 – 2020, (Kilo Tons)
TABLE 10	Global activated carbon market estimates and forecast, by end-use, 2012 – 2020, (Kilo Tons)
TABLE 11	Global powdered activated carbon market estimates and forecast, 2012-2020, (Kilo Tons) (USD Million)
TABLE 12	Global powdered activated carbon market estimates and forecasts by region, 2012-2020, (Kilo Tons)
TABLE 13	Global powdered activated carbon market estimates and forecasts by region, 2012-2020, (USD Million)
TABLE 14	Global granular activated carbon market estimates and forecast, 2012-2020, (Kilo Tons) (USD Million)
TABLE 15	Global granular activated carbon market estimates and forecasts by region, 2012-2020, (Kilo Tons)
TABLE 16	Global granular activated carbon market estimates and forecasts by region, 2012-2020, (USD Million)
TABLE 17	Global other activated carbon products market estimates and forecast, 2012-2020, (Kilo Tons) (USD Million)
TABLE 18	Global other activated carbon products market estimates and forecasts by region, 2012-2020, (Kilo Tons)
TABLE 19	Global other activated carbon products market estimates and forecasts by region, 2012-2020, (USD Million)
TABLE 20	Global activated carbon market estimates and forecasts from liquid phase, 2012-2020, (Kilo Tons) (USD Million)
TABLE 21	Global activated carbon market estimates and forecasts from liquid phase by region, 2012-2020, (Kilo Tons)
TABLE 22	Global activated carbon market estimates and forecasts from liquid phase by region, 2012-2020, (USD Million)
TABLE 23	Global activated carbon market estimates and forecasts from gas phase, 2012-2020, (Kilo Tons) (USD Million)
TABLE 24	Global activated carbon market estimates and forecasts from gas phase by region, 2012-2020, (Kilo Tons)
TABLE 25	Global activated carbon market estimates and forecasts from gas phase by region, 2012-2020, (USD Million)
TABLE 26	Global activated carbon market estimates and forecasts in water treatment, 2012-2020, (Kilo Tons) (USD Million)
TABLE 27	Global activated carbon market estimates and forecasts in water treatment by region, 2012-2020, (Kilo Tons)
TABLE 28	Global activated carbon market estimates and forecasts in water treatment by region, 2012-2020, (USD Million)
TABLE 29	Global activated carbon market estimates and forecasts in food & beverage processing, 2012-2020, (Kilo Tons) (USD Million)
TABLE 30	Global activated carbon market estimates and forecasts in food & beverage processing by region, 2012-2020, (Kilo Tons)
TABLE 31	Global activated carbon market estimates and forecasts in food & beverage processing by region, 2012-2020, (USD Million)
TABLE 32	Global activated carbon market estimates and forecasts in pharmaceutical & medical, 2012-2020, (Kilo Tons) (USD Million)
TABLE 33	Global activated carbon market estimates and forecasts in pharmaceutical & medical by region, 2012-2020, (Kilo Tons)
TABLE 34	Global activated carbon market estimates and forecasts in pharmaceutical & medical by region, 2012-2020, (USD Million)
TABLE 35	Global activated carbon market estimates and forecasts in automotive, 2012-2020, (Kilo Tons) (USD Million)
TABLE 36	Global activated carbon market estimates and forecasts in automotive by region, 2012-2020, (Kilo Tons)
TABLE 37	Global activated carbon market estimates and forecasts in automotive by region, 2012-2020, (USD Million)
TABLE 38	Global activated carbon market estimates and forecasts in air purification, 2012-2020, (Kilo Tons) (USD Million)
TABLE 39	Global activated carbon market estimates and forecasts in air purification by region, 2012-2020, (Kilo Tons)
TABLE 40	Global activated carbon market estimates and forecasts in air purification by region, 2012-2020, (USD Million)
TABLE 41	Global activated carbon market estimates and forecasts in other end-uses, 2012-2020, (Kilo Tons) (USD Million)
TABLE 42	Global activated carbon market estimates and forecasts in other end-uses by region, 2012-2020, (Kilo Tons)
TABLE 43	Global activated carbon market estimates and forecasts in other end-uses by region, 2012-2020, (USD Million)
TABLE 44	North America activated carbon market estimates and forecast, 2012 – 2020, (Kilo Tons) (USD Million)
TABLE 45	North America activated carbon market estimates and forecasts by product, 2012 – 2020, (Kilo Tons)
TABLE 46	North America activated carbon market estimates and forecasts by product, 2012 – 2020, (USD Million)
TABLE 47	North America activated carbon market estimates and forecasts by application, 2012 – 2020, (Kilo Tons)
TABLE 48	North America activated carbon market estimates and forecasts by application, 2012 – 2020, (USD Million)
TABLE 49	North America activated carbon market estimates and forecasts by end-use, 2012 – 2020, (Kilo Tons)
TABLE 50	North America activated carbon market estimates and forecasts by end-use, 2012 – 2020, (USD Million)
TABLE 51	Europe activated carbon market estimates and forecast, 2012 – 2020, (Kilo Tons) (USD Million)
TABLE 52	Europe activated carbon market estimates and forecasts by product, 2012 – 2020, (Kilo Tons)
TABLE 53	Europe activated carbon market estimates and forecasts by product, 2012 – 2020, (USD Million)
TABLE 54	Europe activated carbon market estimates and forecasts by application, 2012 – 2020, (Kilo Tons)
TABLE 55	Europe activated carbon market estimates and forecasts by application, 2012 – 2020, (USD Million)
TABLE 56	Europe activated carbon market estimates and forecasts by end-use, 2012 – 2020, (Kilo Tons)
TABLE 57	Europe activated carbon market estimates and forecasts by end-use, 2012 – 2020, (USD Million)
TABLE 58	Asia Pacific activated carbon market estimates and forecast, 2012 – 2020, (Kilo Tons) (USD Million)
TABLE 59	Asia Pacific activated carbon market estimates and forecasts by product, 2012 – 2020, (Kilo Tons)
TABLE 60	Asia Pacific activated carbon market estimates and forecasts by product, 2012 – 2020, (USD Million)
TABLE 61	Asia Pacific activated carbon market estimates and forecasts by application, 2012 – 2020, (Kilo Tons)
TABLE 62	Asia Pacific activated carbon market estimates and forecasts by application, 2012 – 2020, (USD Million)
TABLE 63	Asia Pacific activated carbon market estimates and forecasts by end-use, 2012 – 2020, (Kilo Tons)
TABLE 64	Asia Pacific activated carbon market estimates and forecasts by end-use, 2012 – 2020, (USD Million)
TABLE 65	RoW activated carbon market estimates and forecast, 2012 – 2020, (Kilo Tons) (USD Million)
TABLE 66	RoW activated carbon market estimates and forecasts by product, 2012 – 2020, (Kilo Tons)
TABLE 67	RoW activated carbon market estimates and forecasts by product, 2012 – 2020, (USD Million)
TABLE 68	RoW activated carbon market estimates and forecasts by application, 2012 – 2020, (Kilo Tons)
TABLE 69	RoW activated carbon market estimates and forecasts by application, 2012 – 2020, (USD Million)
TABLE 70	RoW activated carbon market estimates and forecasts by end-use, 2012 – 2020, (Kilo Tons)
TABLE 71	RoW activated carbon market estimates and forecasts by end-use, 2012 – 2020, (USD Million)

Speak to the report author to design an exclusive study to serve your research needs.
Your personal and confidential information is safe and secure.

